 English
  Русский
 Bahasa Indonesia
 Bahasa Malay
 ไทย
ไทย Español
 Deutsch
 Български
 Français
 Tiếng Việt
 中文
中文 বাংলা
বাংলা हिन्दी
 Čeština
 Українська
 Română

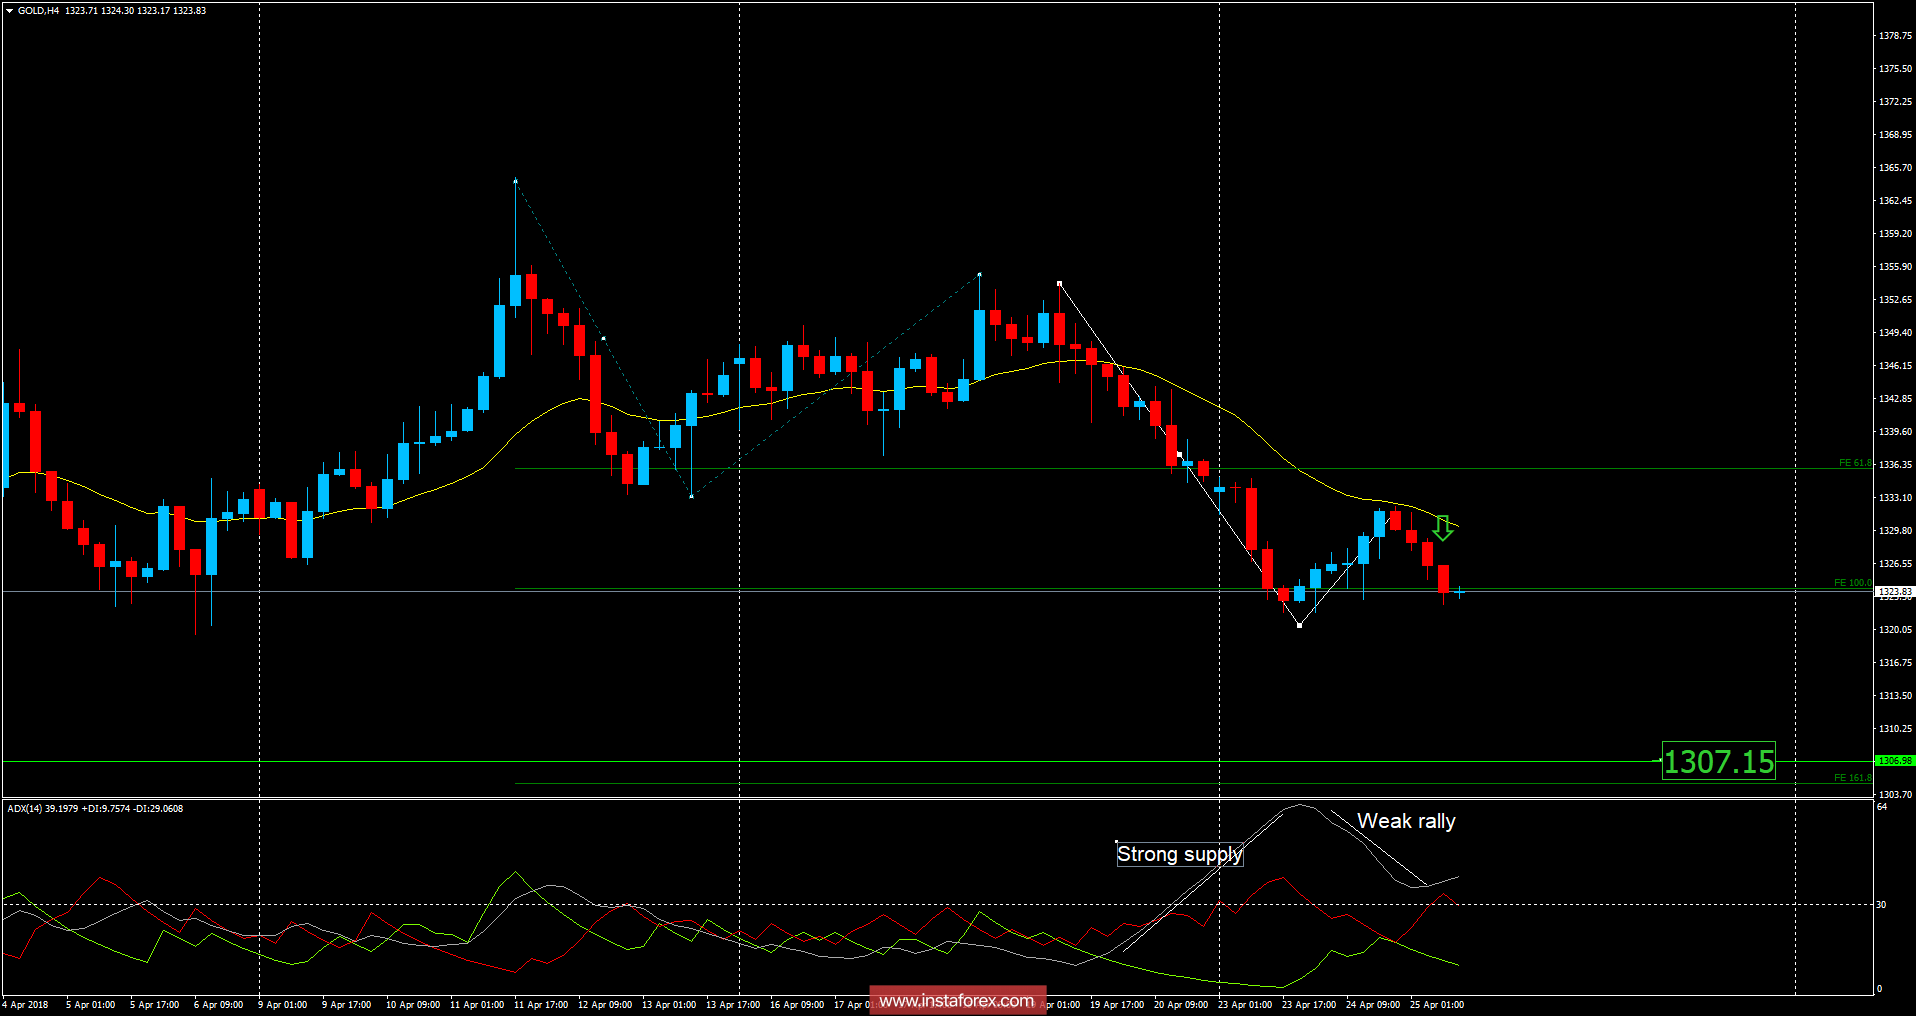
Recently, the Gold has been trading downwards. The price tested the level of $1,321.70. According to the H4 time – frame, I found a strong supply in the background and increase on ADX on the previous downswing, which is a sign that sellers are in control. The previous rally was on decreasing ADX, which is a sign that buyers are weak. My advice is to watch for potential selling opportunities. I placed Fibonacci expansion to find a potential downward target. I got Fibonacci expansion 161.8% at the price of $1,307.00.
Resistance levels:
R1: $1,334.70
R2: $1,338.90
R3: $1,345.28
Support levels:
S1: $1,324.10
S2: $1,317.80
S3: $1,313.51
Trading recommendations for today: watch for potential selling opportunities.