 English
  Русский
 Bahasa Indonesia
 Bahasa Malay
 ไทย
ไทย Español
 Deutsch
 Български
 Français
 Tiếng Việt
 中文
中文 বাংলা
বাংলা हिन्दी
 Čeština
 Українська
 Română

The pair has made a rebound from the support level of 1.3908 and gains are being capped by the resistance zone of 1.3991. A break above that area should expose the 200 SMA at H1 chart, which is a dynamic barrier that could help to block further advances in the Cable. However, if the aforementioned support gives up, then it can plummet to test the 1.3860 level.
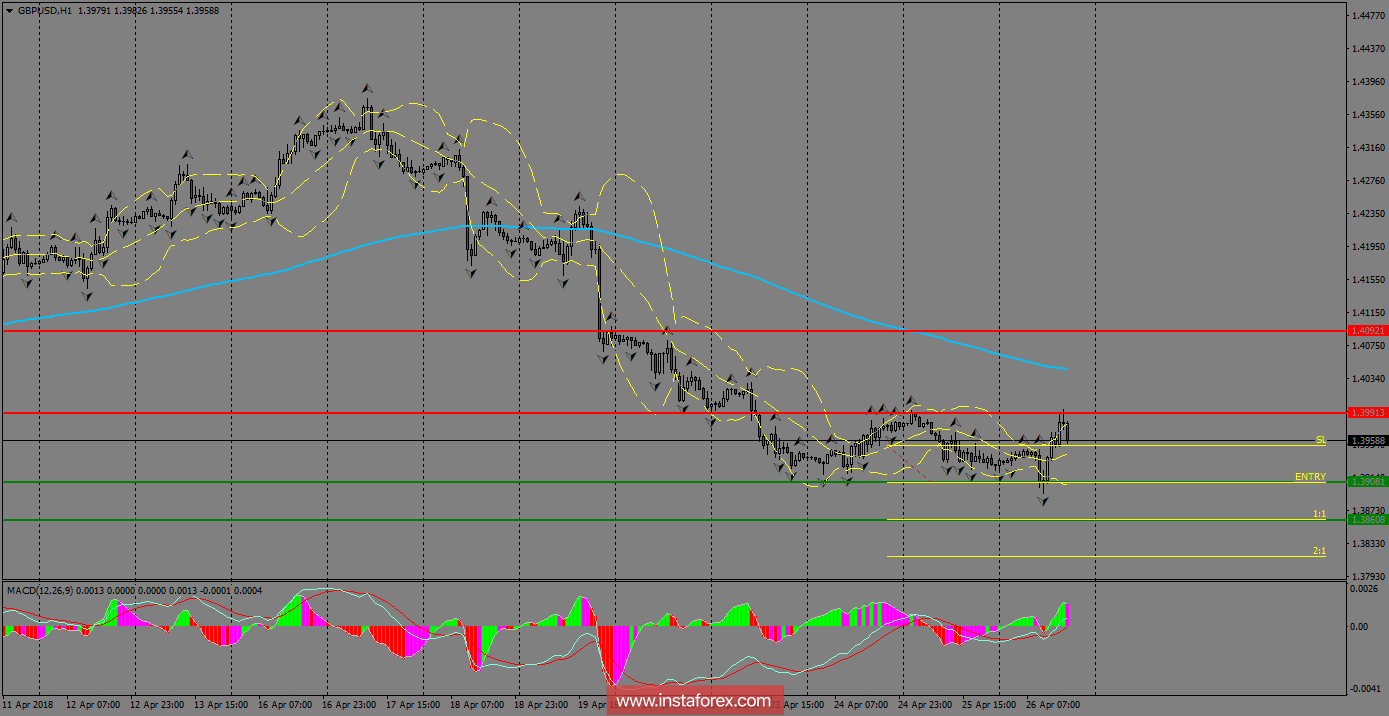
H1 chart's resistance levels: 1.3991 / 1.4092
H1 chart's support levels: 1.3908 / 1.3860
Trading recommendations for today: Based on the H1 chart, sell (short) orders only if the GBP/USD pair breaks a bullish candlestick; the resistance level is at 1.3908, take profit is at 1.3860, and stop loss is at 1.3951.