 English
  Русский
 Bahasa Indonesia
 Bahasa Malay
 ไทย
ไทย Español
 Deutsch
 Български
 Français
 Tiếng Việt
 中文
中文 বাংলা
বাংলা हिन्दी
 Čeština
 Українська
 Română

The index is looking for fresh highs across the board following a breakout above the 90.63 level, which was a key resistance. The next target to the upside lies at 91.75, where the bears could gather momentum in order to push lower the US Dollar Index and if that happens, the 200 SMA at H1 chart could be tested.
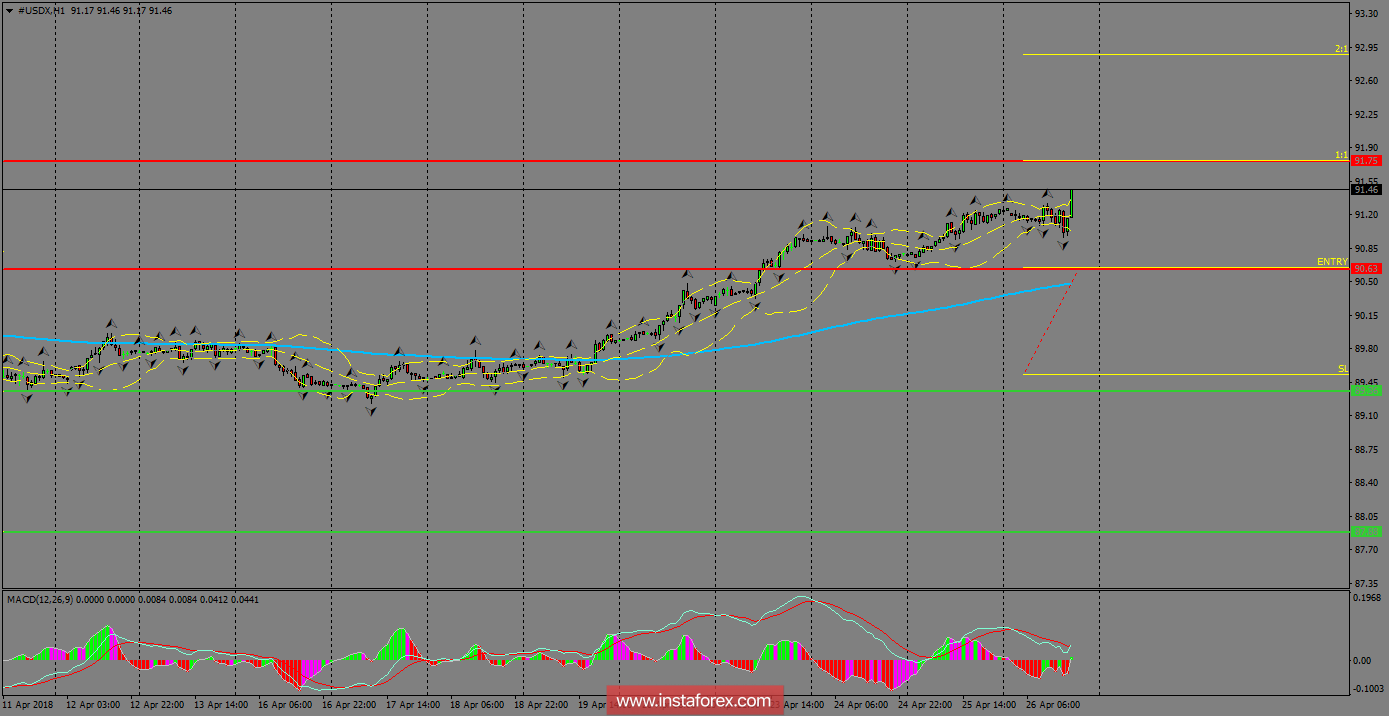
H1 chart's resistance levels: 90.63 / 91.75
H1 chart's support levels: 89.36 / 87.88
Trading recommendations for today: Based on the H1 chart, place buy (long) orders only if the USD Index breaks with a bearish candlestick; the support level is at 90.63, take profit is at 91.75, and stop loss is at 89.49.