 English
  Русский
 Bahasa Indonesia
 Bahasa Malay
 ไทย
ไทย Español
 Deutsch
 Български
 Français
 Tiếng Việt
 中文
中文 বাংলা
বাংলা हिन्दी
 Čeština
 Українська
 Română

The gold price has broken above the downward sloping wedge pattern and is now back-testing it. Gold could make one more new lower low around $1,311 today before reversing its trend to the upside. The trend remains bearish as the 4-hour candlestick is still below both the tankan- and kijun-sen indicators.
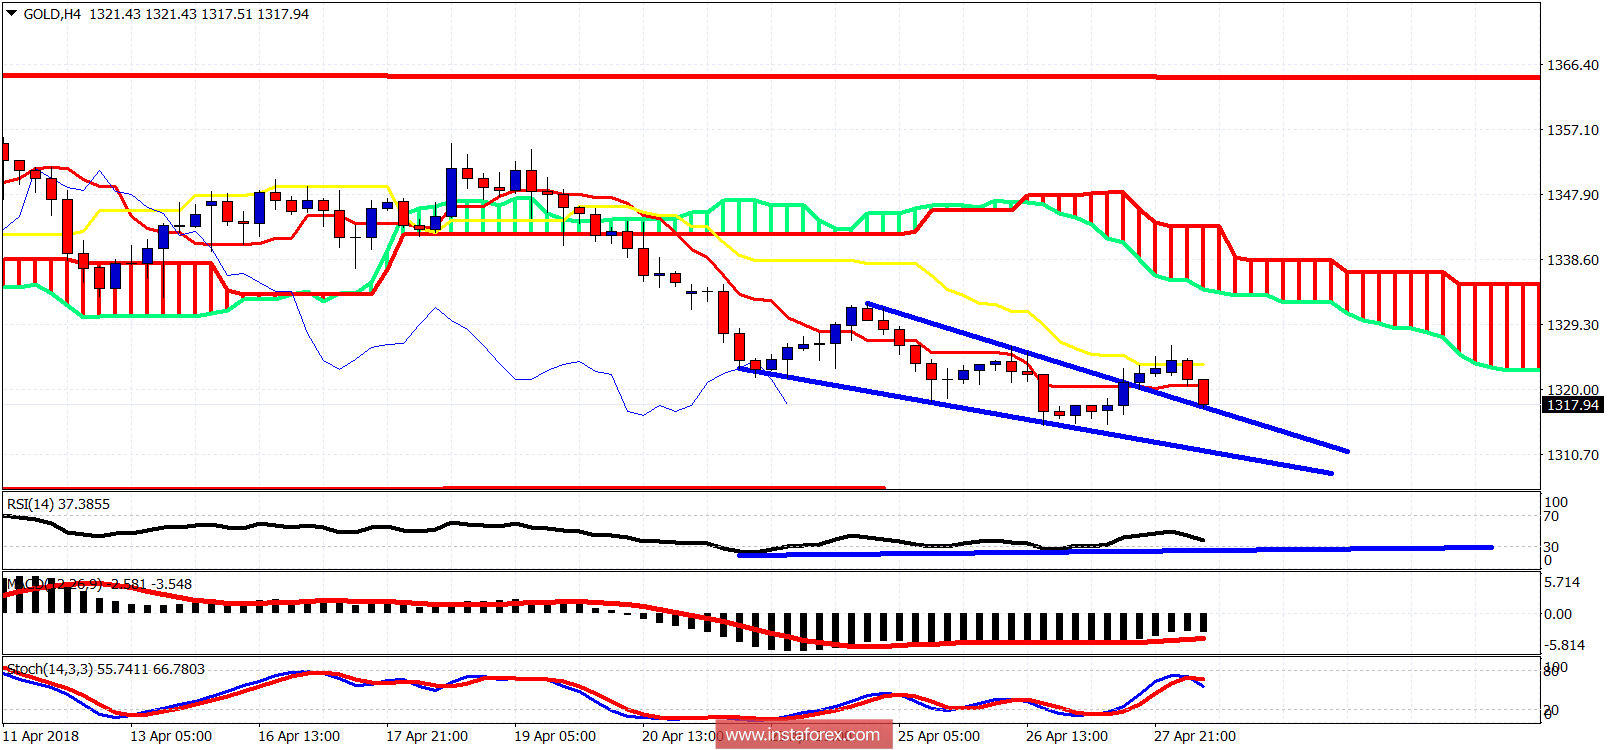
Red line - resistance
Blue lines - wedge pattern
Upward sloping blue line - bullish divergence
The gold price has short-term support at $1,311 where we find the lower wedge pattern boundary. $1,320-24 is short-term resistance. In case of a break above it, we could see a test of the 4-hour cloud at $1,333. The short-term trend changes to bullish on a break above $1,338. I prefer to get bullish on gold around $1,310-$1,300 or with a break above $1,324. I expect the gold price to bounce soon.