 English
  Русский
 Bahasa Indonesia
 Bahasa Malay
 ไทย
ไทย Español
 Deutsch
 Български
 Français
 Tiếng Việt
 中文
中文 বাংলা
বাংলা हिन्दी
 Čeština
 Українська
 Română

Gold price is still in a down trend. Price remains below the $1,320-25 resistance area that if broken will be the first reversal signal. Support remains at $1,300-$1,310. Gold medium-term trend remains neutral as price is still inside the $1,365-$1,300 trading range. Gold price is showing bullish divergence signs. I expect Gold to provide a big bounce higher.
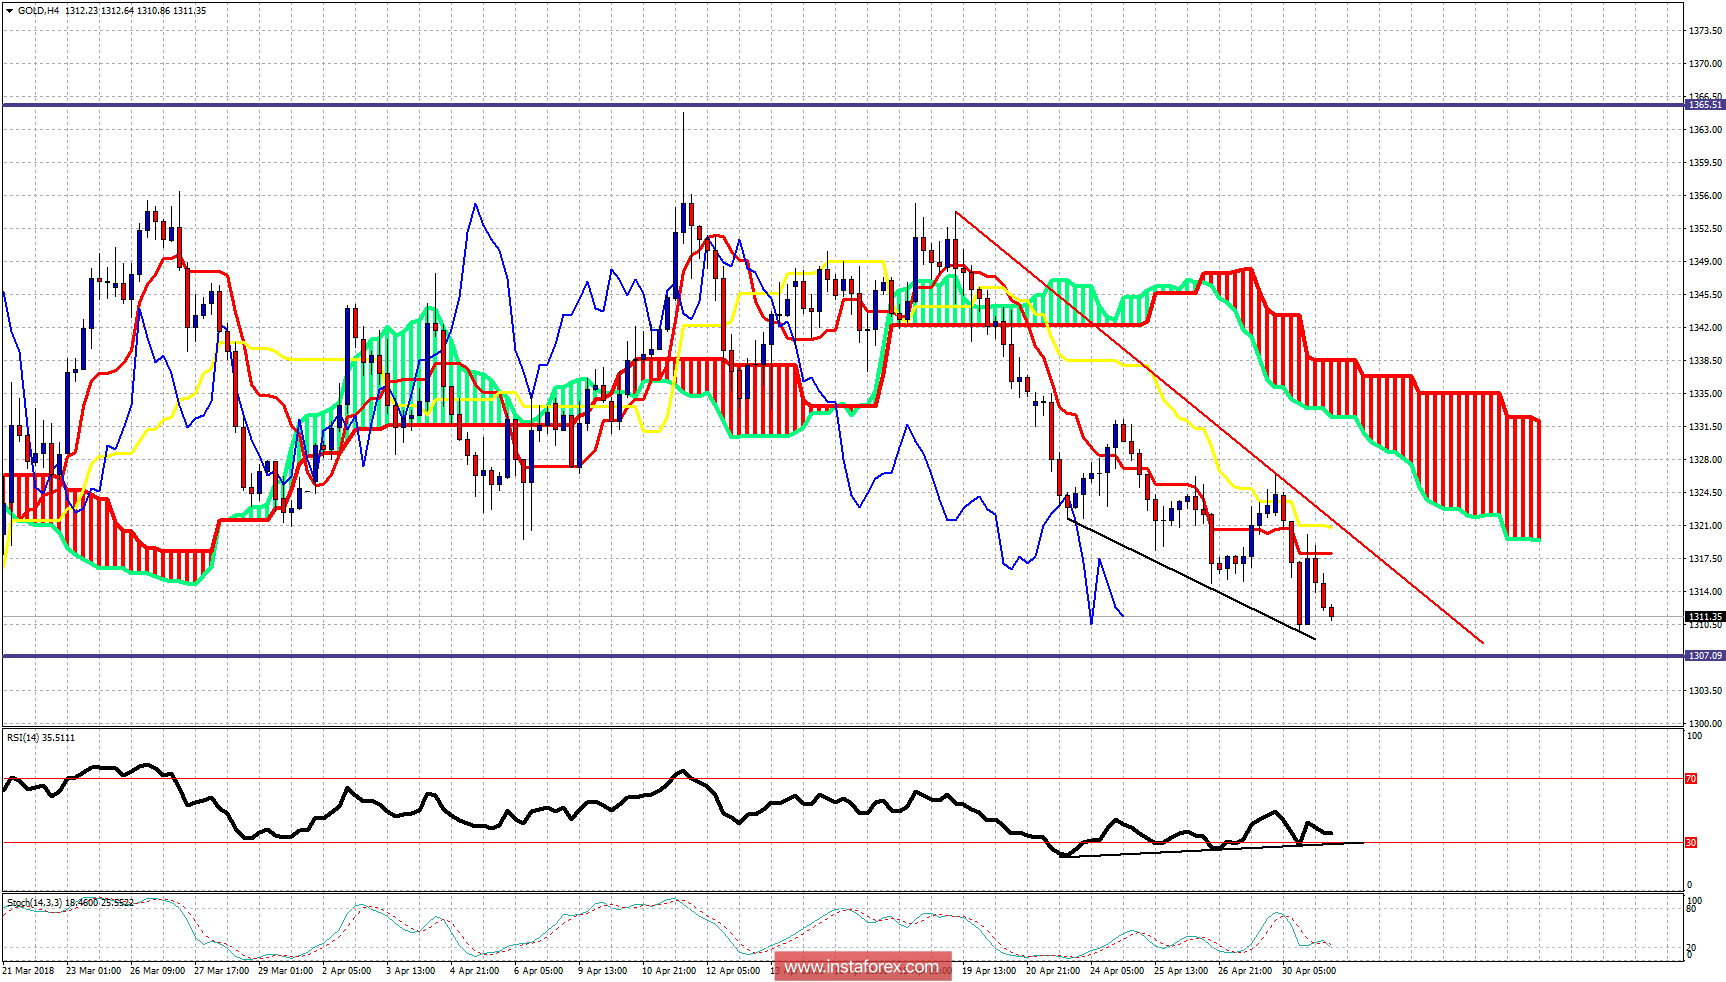
Blue lines - trading range
Red line - resistance
Black lines - bullish divergence
Short-term resistance is found at $1,317 and most importantly at $1,321. Price got rejected at the 4-hour Kijun-sen indicator (yellow line) yesterday. Bulls need to break above the kijun-sen and the red downward sloping trend line to start a bounce towards $1,332 at least. Downside is limited. I expect price to start a reversal to the upside from $1,310-$1,300 area.