 English
  Русский
 Bahasa Indonesia
 Bahasa Malay
 ไทย
ไทย Español
 Deutsch
 Български
 Français
 Tiếng Việt
 中文
中文 বাংলা
বাংলা हिन्दी
 Čeština
 Українська
 Română

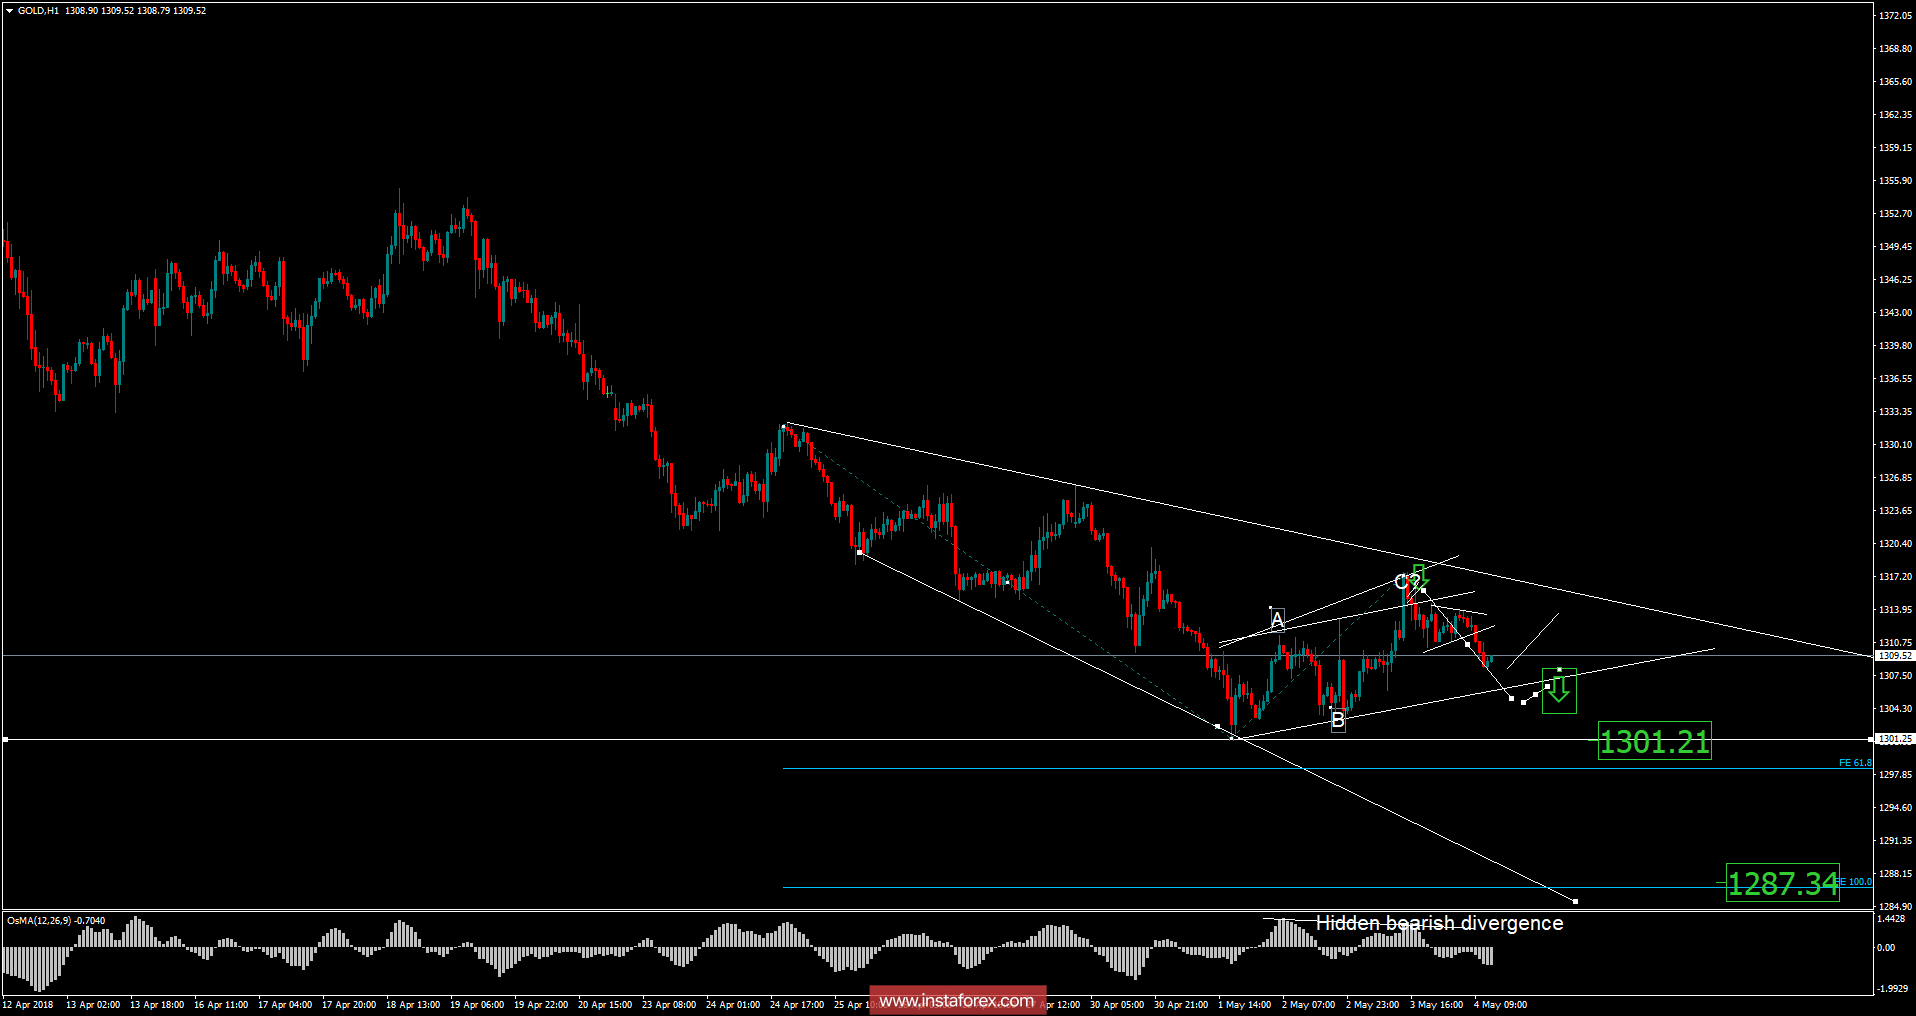
Recently, Gold has been trading sideways at the price of$1,309.00. According to the H1 time frame, I found that Gold is trading inside of the upward channel (a potential bearish flag), which is a sign that selling looks risky. I also found a potential expanding diagonal pattern, which is another sign of weakness. My advice is to watch for potential selling opportunities only if you see a valid breakout of flag ($1,305.00). Downward targets are set at the price of $1,301.20 and $1,287.35.
Resistance levels:
R1: $1,318.77
R2: $1,325.38
R3: $1,332.65
Support levels:
S1: $1,304.90
S2: $1,297.65
S3: $1,291.03
Trading recommendations for today: watch for potential selling opportunities if you see a valid breakout of the bearish flag.