 English
  Русский
 Bahasa Indonesia
 Bahasa Malay
 ไทย
ไทย Español
 Deutsch
 Български
 Français
 Tiếng Việt
 中文
中文 বাংলা
বাংলা हिन्दी
 Čeština
 Українська
 Română

GBP/USD is still struggling to consolidate below the 200 SMA on H1 chart, as it managed to act once again as a dynamic resistance during Thursday's session. However, the focus is still placed to the downside. Eventually, if the pair does a breakout below the 1.3480 level, the can plummet towards the 1.3342 level.
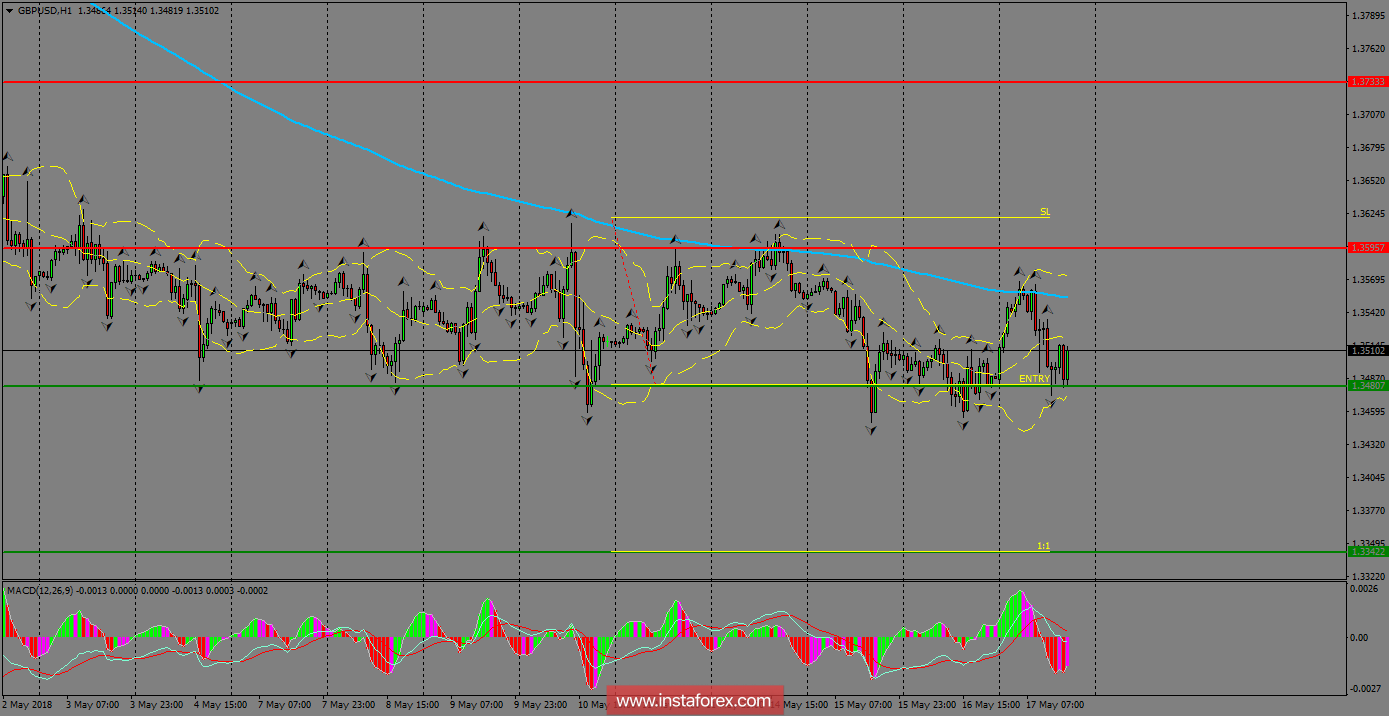
H1 chart's resistance levels: 1.3595 / 1.3733
H1 chart's support levels: 1.3480 / 1.3342
Trading recommendations for today: Based on the H1 chart, sell (short) orders only if the GBP/USD pair breaks a bullish candlestick; the resistance level is at 1.3480, take profit is at 1.3342 and stop loss is at 1.3618.