 English
  Русский
 Bahasa Indonesia
 Bahasa Malay
 ไทย
ไทย Español
 Deutsch
 Български
 Français
 Tiếng Việt
 中文
中文 বাংলা
বাংলা हिन्दी
 Čeština
 Українська
 Română

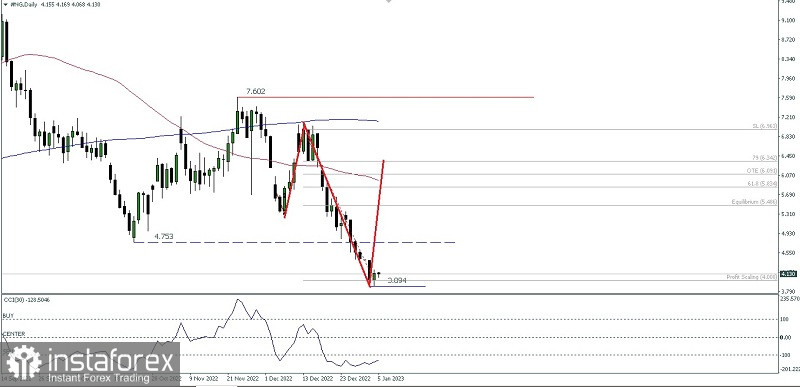
On the daily chart USD/MXN currency pairs move inside the channel that dips down (Bearish) and the Moving Average is still in a Death Cross condition and the CCI is below level 0 where this all indicates that in the near future USD/MXN will drop down to the level of 19,036 in the next few days but if it is on its way towards that level suddenly there is an upward correction that exceeds the level of 19,582, so the decline scenario described earlier will become invalid.
(Disclaimer)