 English
  Русский
 Bahasa Indonesia
 Bahasa Malay
 ไทย
ไทย Español
 Deutsch
 Български
 Français
 Tiếng Việt
 中文
中文 বাংলা
বাংলা हिन्दी
 Čeština
 Українська
 Română

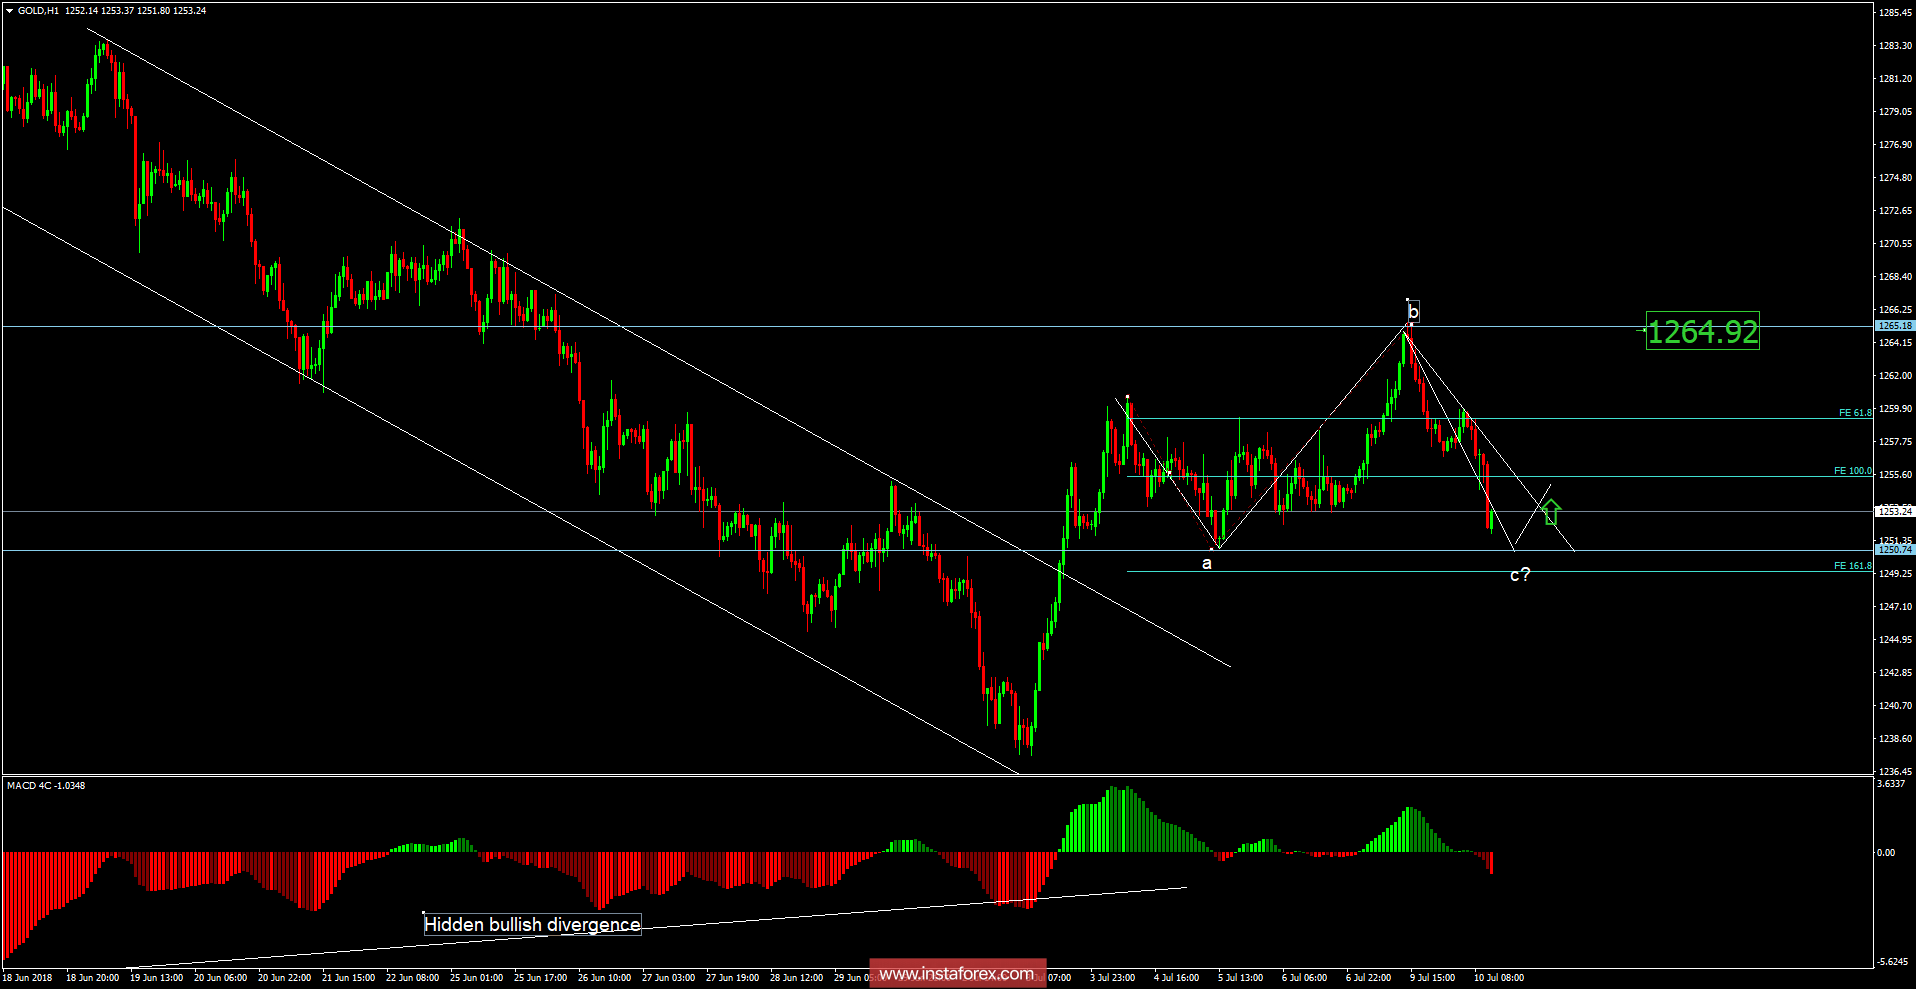
Recently, Gold has been trading downwards. The price tested the level of $1,253.00. According to the H1 time - frame, I found a potential completion of downward correction (abc flat), which is a sign that selling at this stage looks risky. I also found a hidden bullish divergence in the background, which is another sign of strength. My advice is to watch for a potential breakout of the supply trendline to confirm a further upward direction. The upward target is set at the price of $1,264.90.
Resistance levels: R1: $1,265.20R2: $1,271.50R3: $1,275.40
Support levels: S1: $1,254.60S2: $1,250.20S3: $1,244.40
Trading recommendations for today: watch for potential buying opportunities.