 English
  Русский
 Bahasa Indonesia
 Bahasa Malay
 ไทย
ไทย Español
 Deutsch
 Български
 Français
 Tiếng Việt
 中文
中文 বাংলা
বাংলা हिन्दी
 Čeština
 Українська
 Română

The USD/JPY is challenging important long-term resistance. The weekly close will be very important. The USD/JPY is challenging the long-term resistance trend line coming from 125.60 back in 2015, that has already been tested 6 times the past years and got rejected.
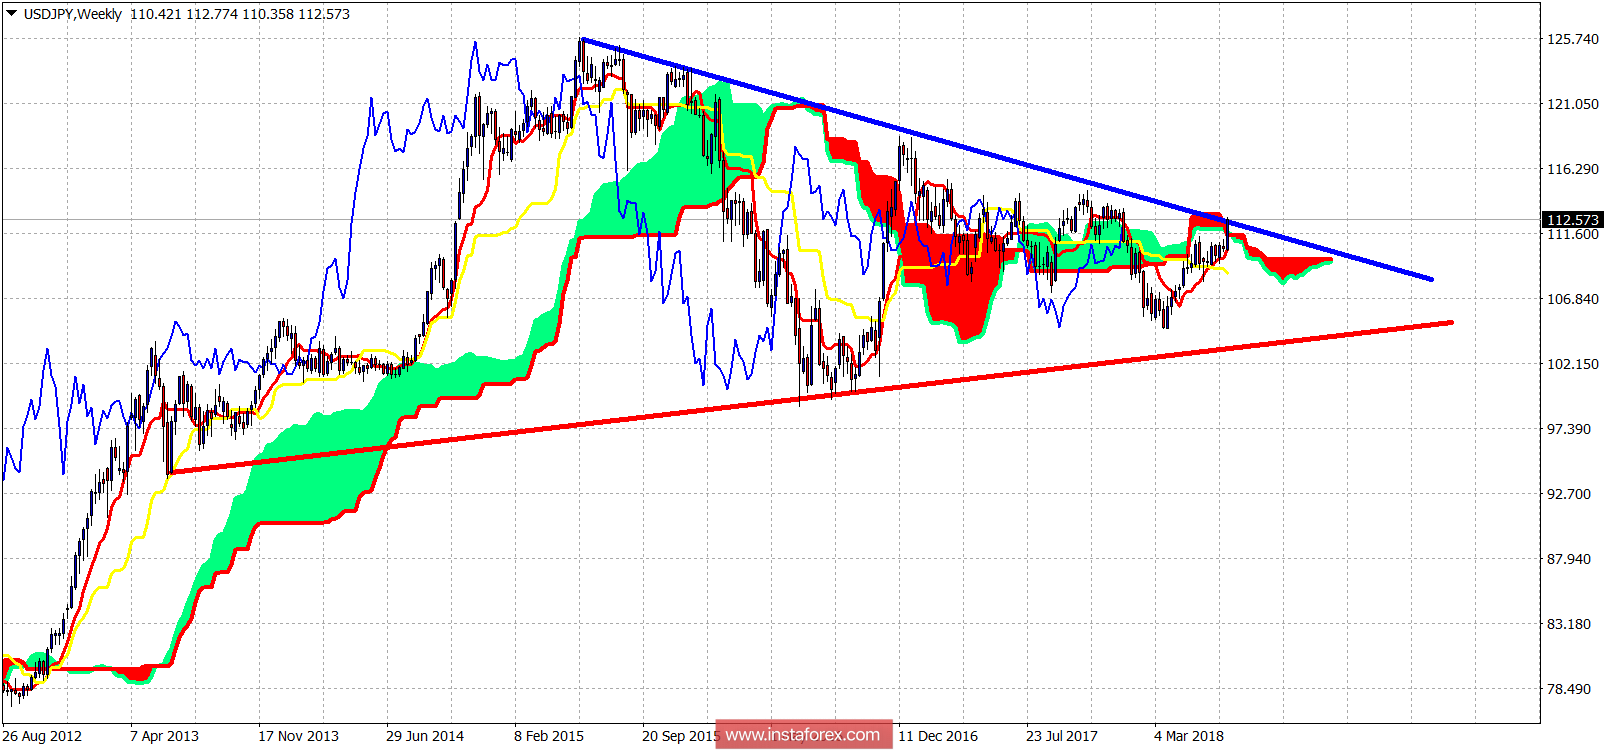
Blue line - long-term resistance
Red line - long-term support
The USD/JPY is also challenging weekly cloud resistance here at 112.60-112.70 area. Will the USD/JPY break above this huge triangle pattern? At current levels, traders should better be patient and neutral than chase long positions in USD/JPY.