 English
  Русский
 Bahasa Indonesia
 Bahasa Malay
 ไทย
ไทย Español
 Deutsch
 Български
 Français
 Tiếng Việt
 中文
中文 বাংলা
বাংলা हिन्दी
 Čeština
 Українська
 Română

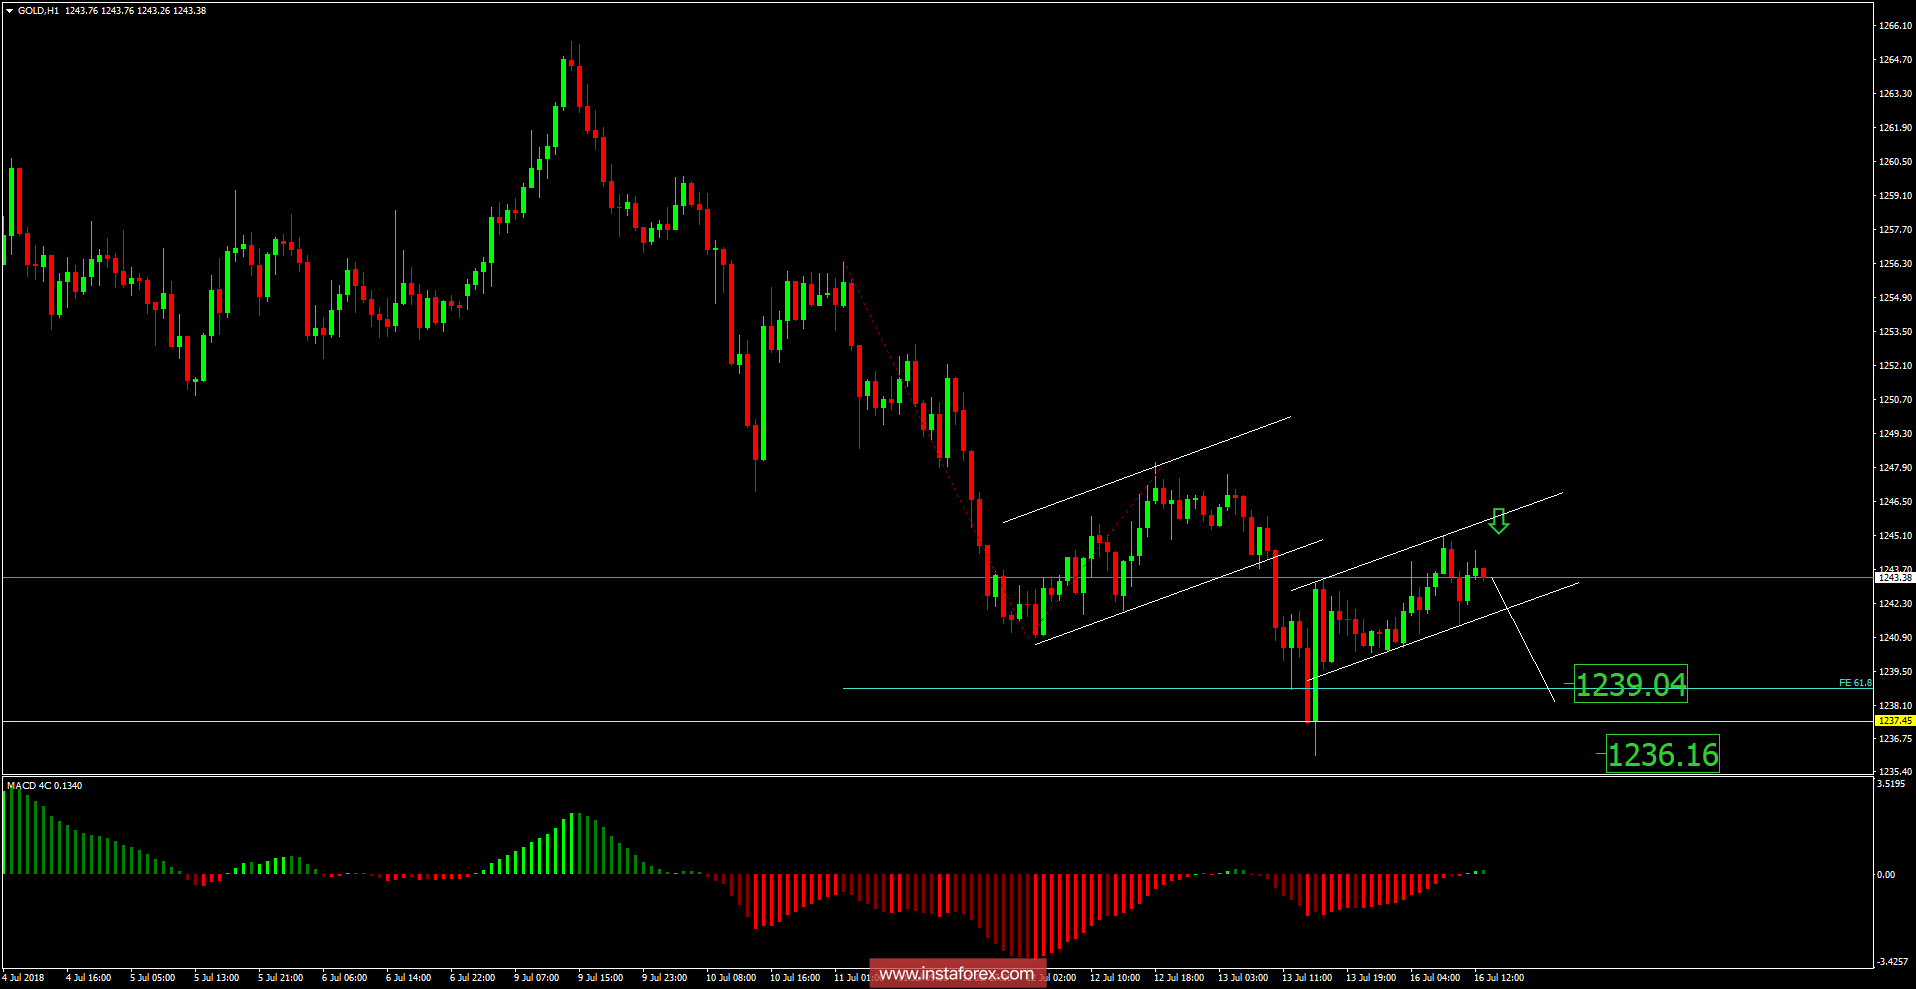
Recently, Gold has been trading sideways at the price of $1,243.30. According to the H1 time - frame, I found a breakout of the bearish flag in the background, which is a sign that sellers are in control. Anyway, most recently there is an intraday upward channel in creation. My advice is to watch for a potential breakout of the channel to confirm a downward movement. The downward targets are set at the price of $1,239.00 and at the price of $1,236.15.
Resistance levels: R1: $1,242.00R2: $1,243.00R3: $1,243.50
Support levels: S1: $1,240.45S2: $1,239.90S3: $1,239.00
Trading recommendations for today: watch for potential selling opportunities.