 English
  Русский
 Bahasa Indonesia
 Bahasa Malay
 ไทย
ไทย Español
 Deutsch
 Български
 Français
 Tiếng Việt
 中文
中文 বাংলা
বাংলা हिन्दी
 Čeština
 Українська
 Română

The Gold price remains near its 2018 lows. The trend remains bearish and there is no sign of a bullish reversal yet. The Gold price is oversold at current levels and we should focus on bullish trades than bearish ones.
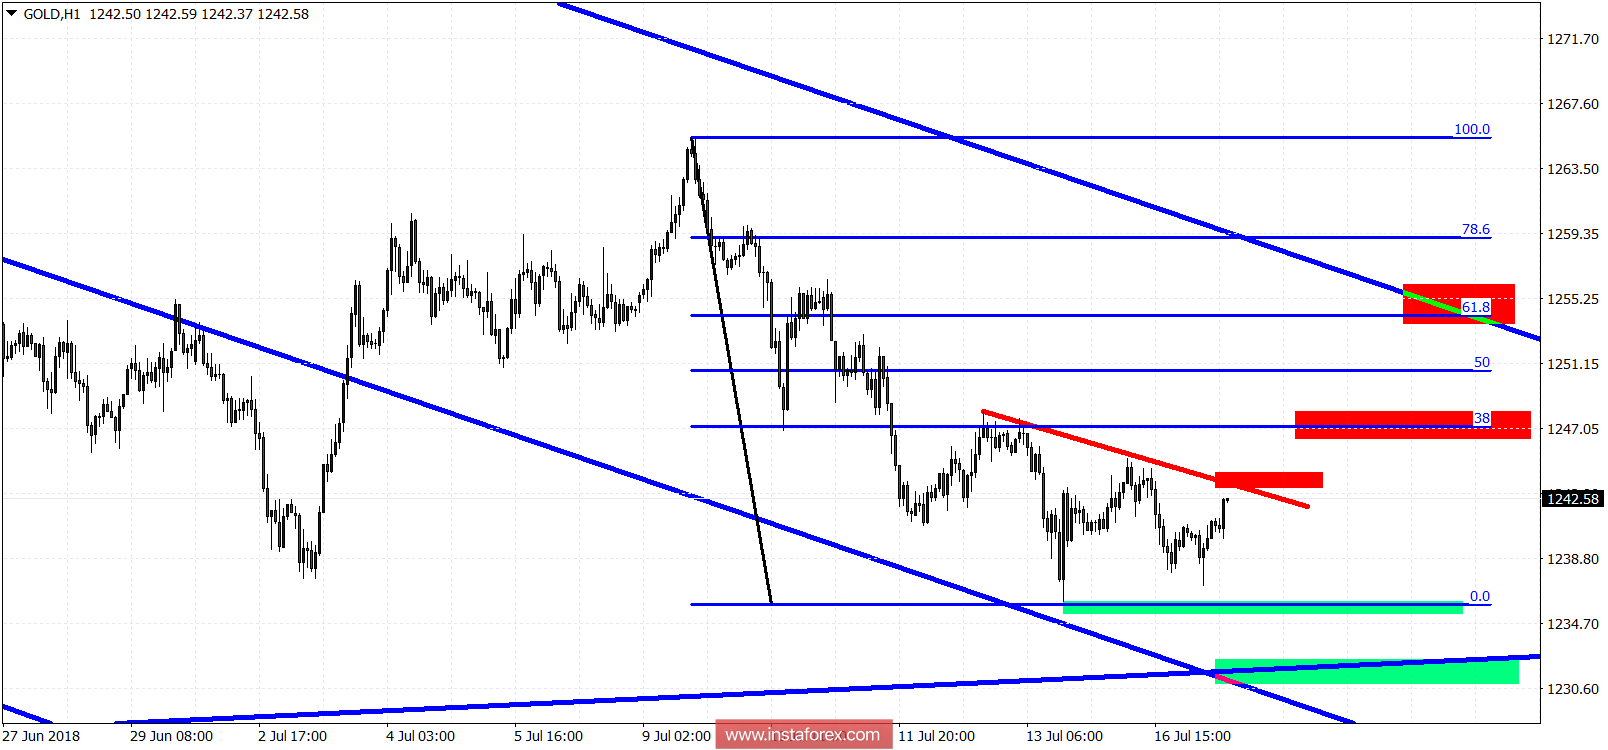
Red rectangles - resistance levels
Blue lines - pitchfork channel
Red line - short-term resistance
Short-term resistance is at $1,244-45. A break above this level justifies a move higher towards the 38% Fibonacci retracement at $1,247. A break above this Fibonacci resistance could push price towards the upper pitchfork boundary and 61.8% Fibonacci retracement level at $1,254. The short-term and medium-term trend could change only on a break above this level. Support is found at $1,235 and next at $1,231.