 English
  Русский
 Bahasa Indonesia
 Bahasa Malay
 ไทย
ไทย Español
 Deutsch
 Български
 Français
 Tiếng Việt
 中文
中文 বাংলা
বাংলা हिन्दी
 Čeština
 Українська
 Română

The Gold price is making new 2018 lows. The price is visiting levels last seen in the summer of 2017. The long-term trend line support we showed yesterday has been broken for the time being. Only a weekly close above $1,240 would give Gold bulls hope of a reversal.
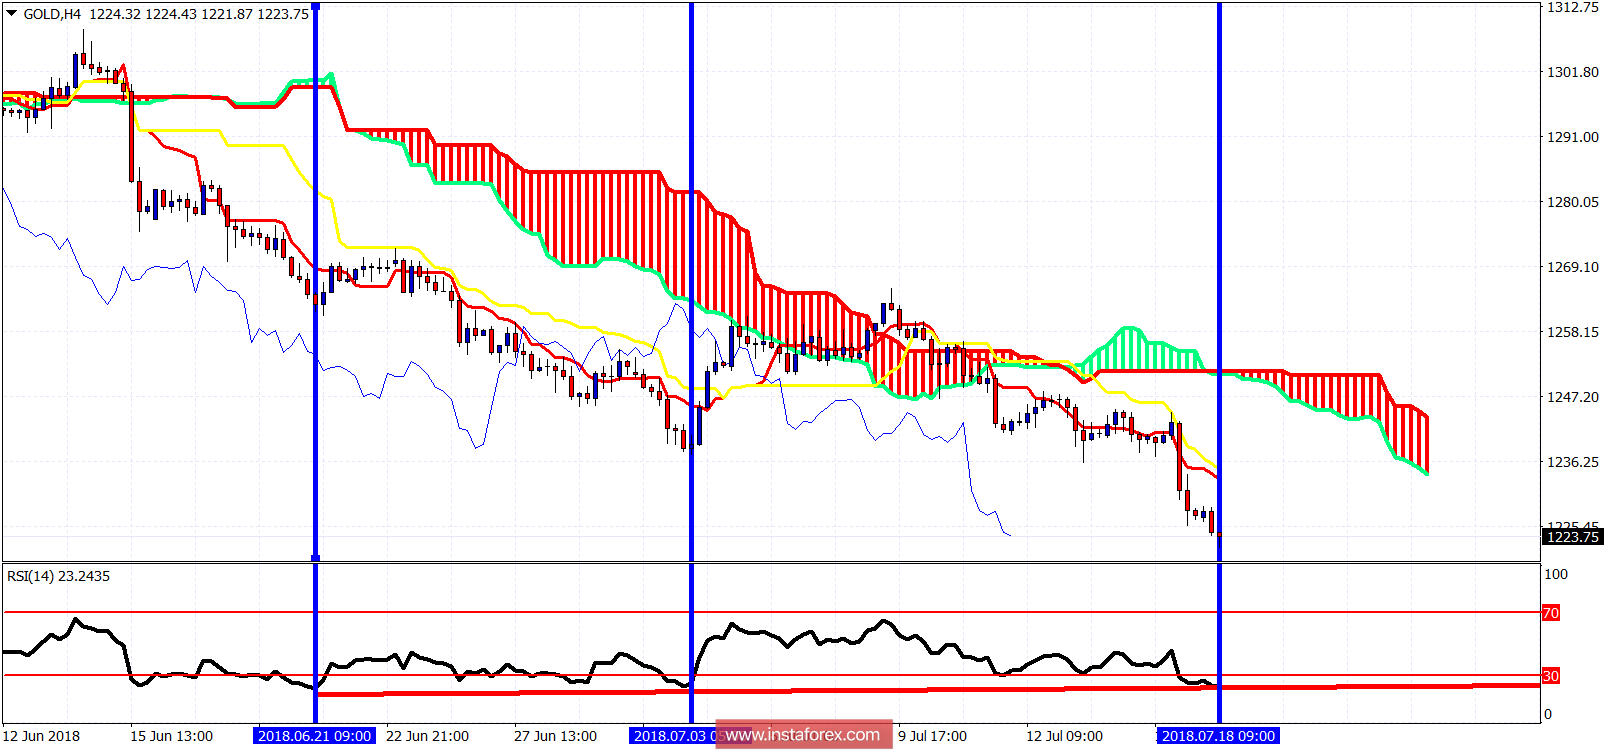
Blue lines - the bullish divergence remains
Red line - RSI support/bullish divergence
The Gold price broke below $1,237-35 support area and has visited $1,220 area as expected. Despite the new low the RSI did not make a new lower low. The RSI is at a higher level even since the low made on July 3rd near $1,236. Cloud resistance is found at $1,247 and bulls need to break this level to change short-term trend to bullish again. The RSI is also diverging on a daily basis and is very oversold on a weekly basis as well. This is not the time be chasing a short trade in Gold. At least a bounce towards $1,240-45 will come soon.