 English
  Русский
 Bahasa Indonesia
 Bahasa Malay
 ไทย
ไทย Español
 Deutsch
 Български
 Français
 Tiếng Việt
 中文
中文 বাংলা
বাংলা हिन्दी
 Čeština
 Українська
 Română

Yesterday I warned EUR/USD bulls that the price was challenging important cloud resistance at 1.1730-1.1760. A rejection at that level could push the price below 1.17 towards the lower triangle boundary around 1.1620. This is exactly what happened.
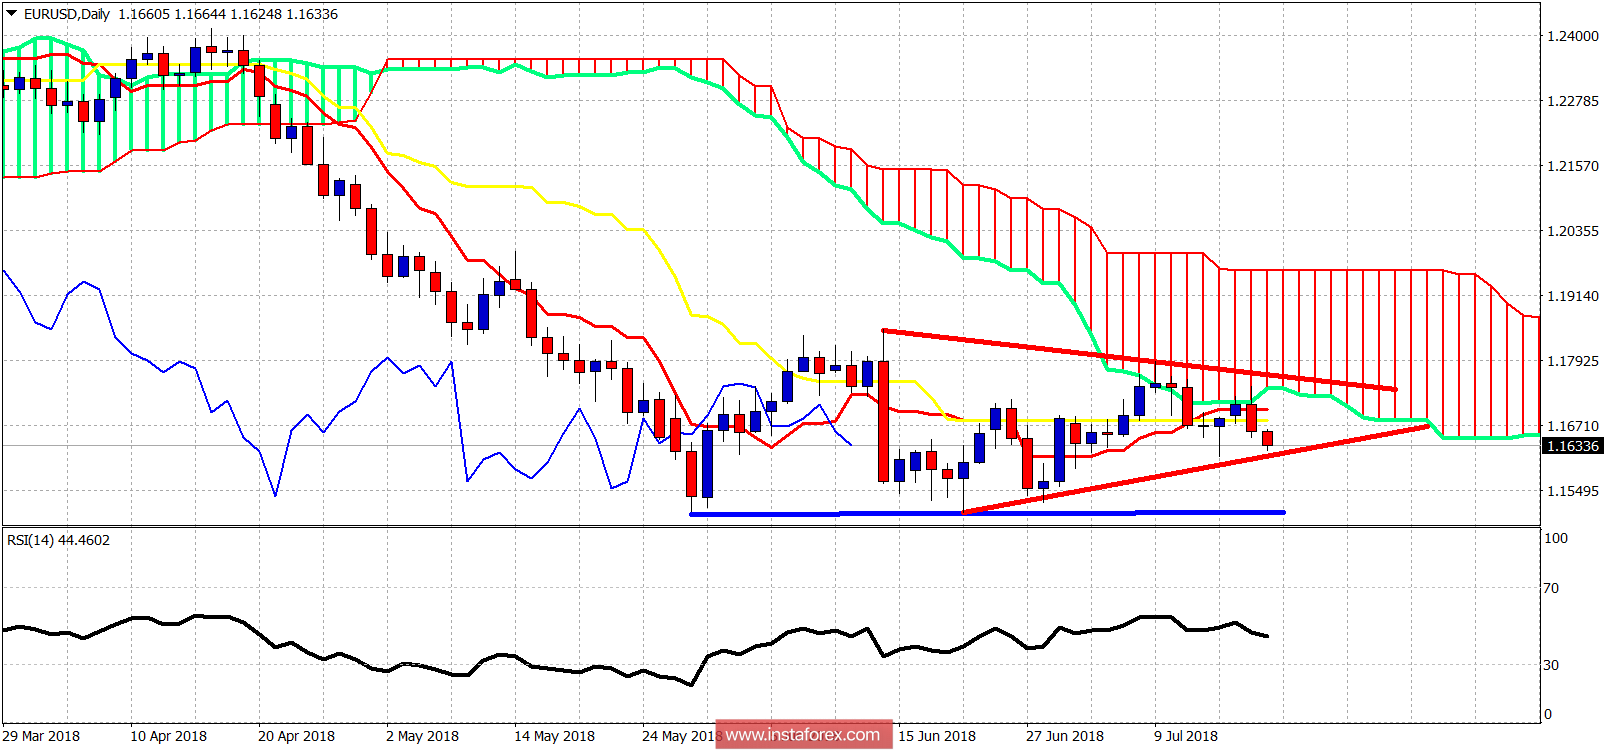
Blue line - important support
The EUR/USD got rejected at the lower cloud boundary and pulled back towards the lower triangle boundary which is short-term support. A break below this level will open the way for a move towards 1.15 with very high chances of breaking below 1.15. As we previously said, as long as EUR/USD is below 1.1760 we remain bearish.