 English
  Русский
 Bahasa Indonesia
 Bahasa Malay
 ไทย
ไทย Español
 Deutsch
 Български
 Français
 Tiếng Việt
 中文
中文 বাংলা
বাংলা हिन्दी
 Čeština
 Українська
 Română

The Gold price remains in a bearish trend in 2018 lows. Gold price continues to make lower lows and lower highs. Change in trend to bullish will change only on a break above $1,245. A weekly close above this level will also be a very bullish signal.
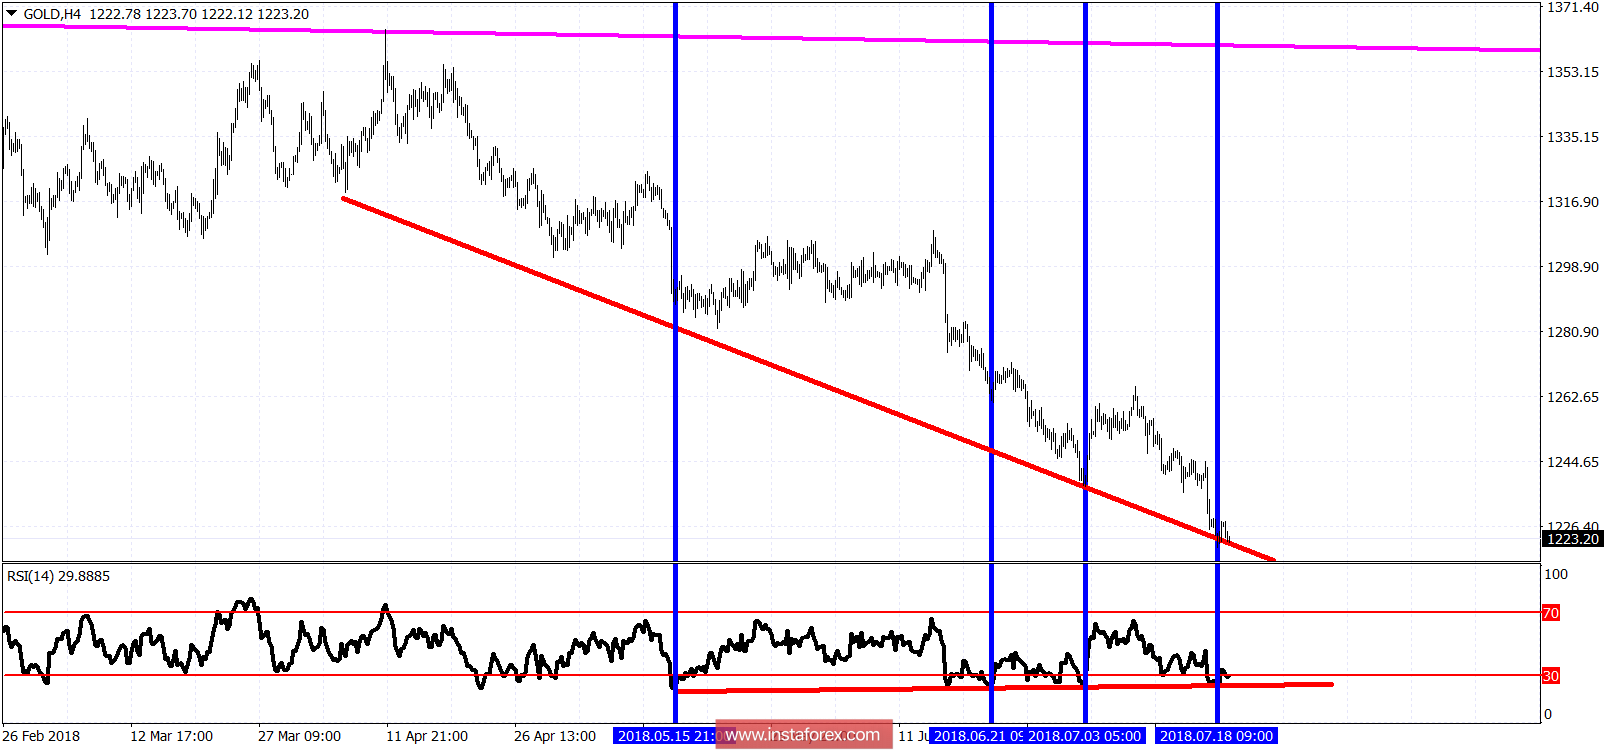
Blue lines - higher RSI lows bullish divergence
We have been noticing higher lows in the 4-hour RSI since $1,240-45 area. The new low at $1,220 was accompanied by another higher low. The end of the decline is very close for Gold. Short-term resistance is at $1,235 and next and most important is at $1,240-45.