 English
  Русский
 Bahasa Indonesia
 Bahasa Malay
 ไทย
ไทย Español
 Deutsch
 Български
 Français
 Tiếng Việt
 中文
中文 বাংলা
বাংলা हिन्दी
 Čeština
 Українська
 Română

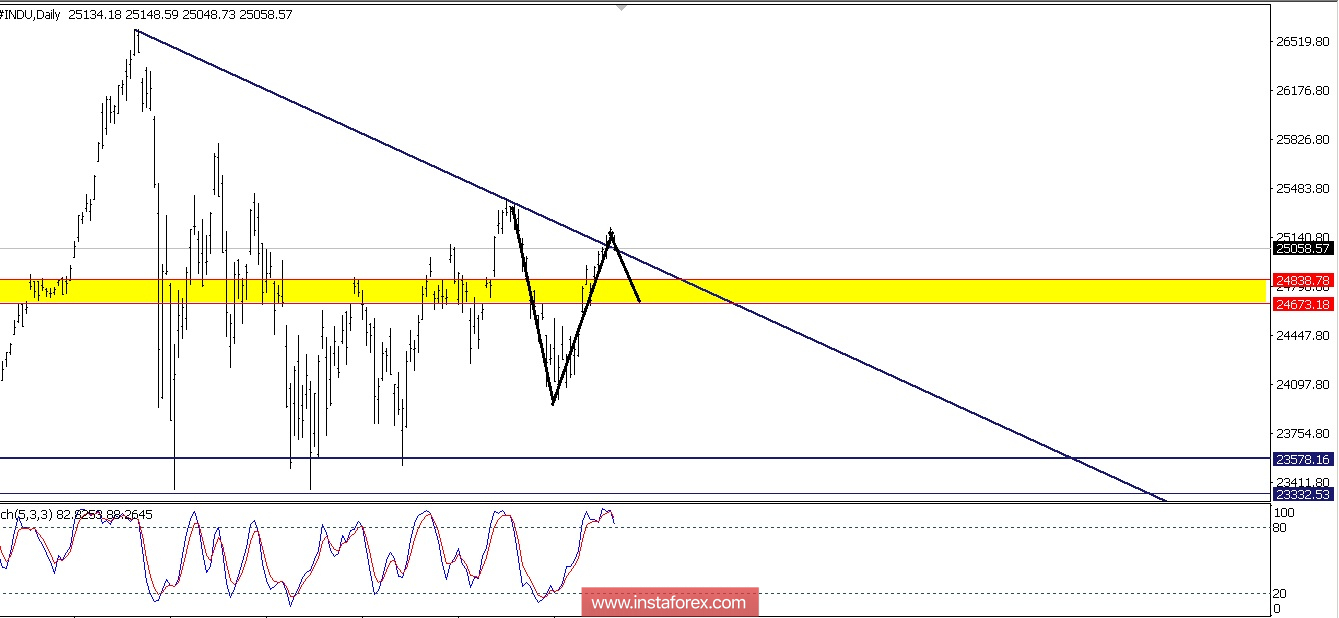
If we look at the daily chart, the INDU is now moving in a triangle pattern. It means the volatility for this index will decrease approximately on July 26-27, 2018 and the index will hit the lowest level between the August 2-3, 2018 or August 9-10, 2018.