 English
  Русский
 Bahasa Indonesia
 Bahasa Malay
 ไทย
ไทย Español
 Deutsch
 Български
 Français
 Tiếng Việt
 中文
中文 বাংলা
বাংলা हिन्दी
 Čeština
 Українська
 Română

The EUR/USD was in the process of breaking below the triangle pattern and below 1.16 support when the comments by POTUS weakened the Dollar as he questions the policy Fed follows. The EUR/USD has bounced strongly towards cloud resistance.
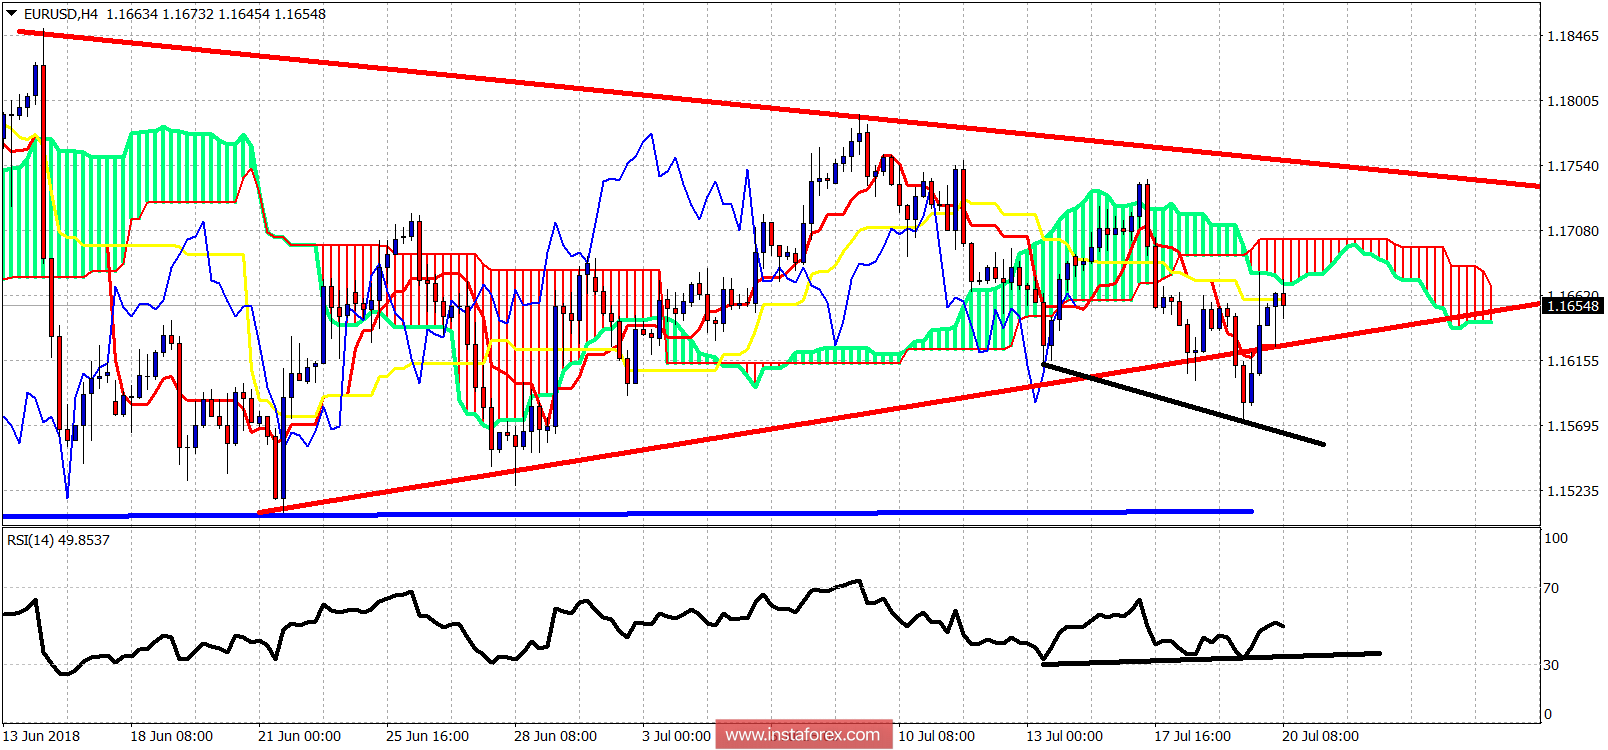
Blue line -critical support
Black lines - bullish divergence
In the 4-hour chart, as shown above, we have a bullish RSI divergence as the RSI did not make new lows together with the price. The price has bounced strongly towards cloud resistance. Bulls need to break above 1.1680-1.17 to change short-term trend to bullish again. A break back below 1.16 combined with a new RSI lower low would be a bearish signal for EUR/USD that could lead towards 1.15 and lower. Major resistance remains at 1.1750-1.1760.