 English
  Русский
 Bahasa Indonesia
 Bahasa Malay
 ไทย
ไทย Español
 Deutsch
 Български
 Français
 Tiếng Việt
 中文
中文 বাংলা
বাংলা हिन्दी
 Čeština
 Українська
 Română

The Gold price remains inside the downward sloping wedge pattern. The Gold price got rejected at the upper wedge boundary yesterday.
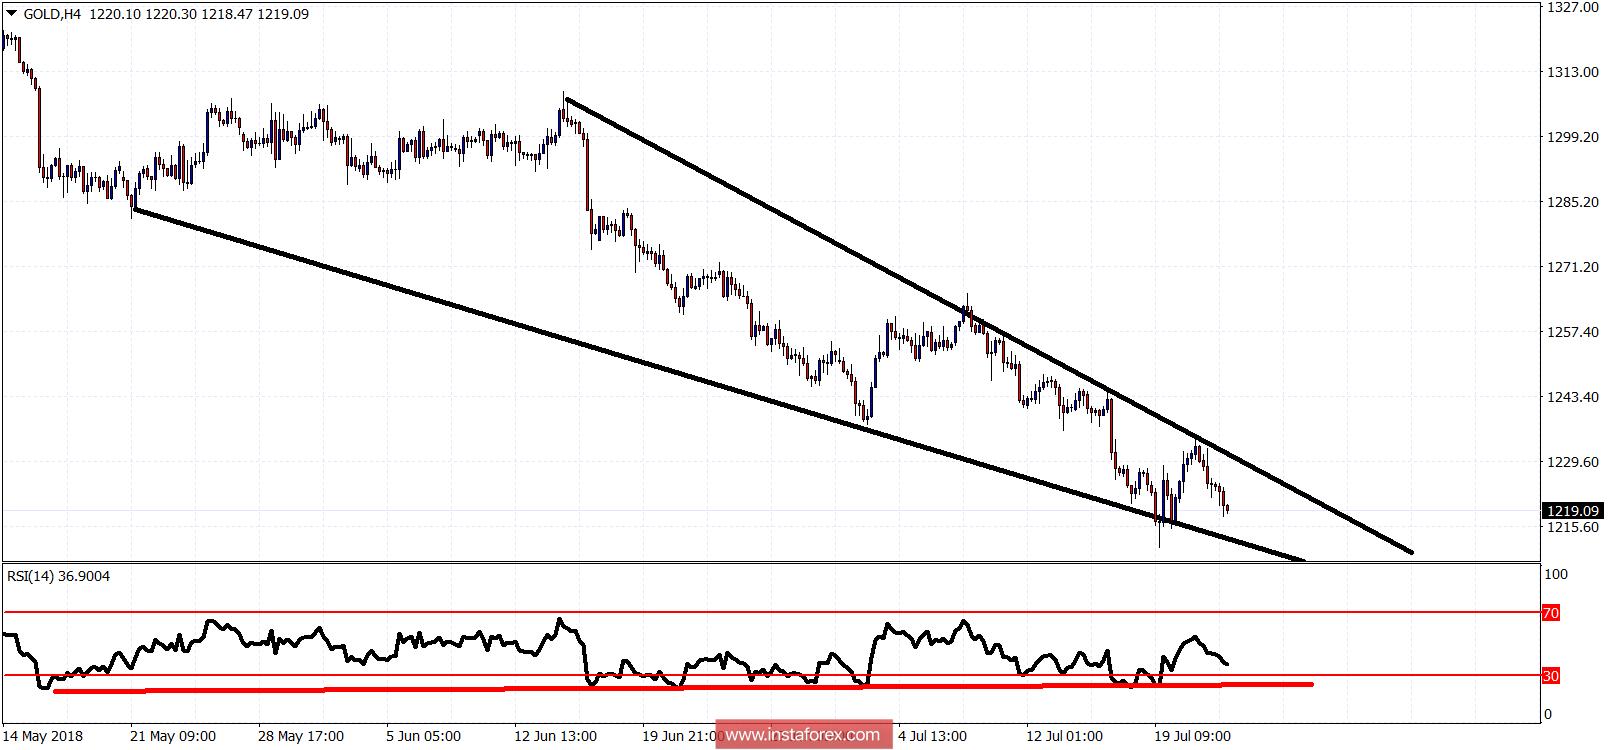
Red line - bullish divergence
The Gold price continues to make lower lows and lower highs. The trend remains bearish. Support is at $1,212 and next at $1,200. Resistance is at $1,230 and $1,235. Bulls need to break out above the wedge pattern for a bigger bounce to come. The bullish divergence signs justify a bigger bounce.