 English
  Русский
 Bahasa Indonesia
 Bahasa Malay
 ไทย
ไทย Español
 Deutsch
 Български
 Français
 Tiếng Việt
 中文
中文 বাংলা
বাংলা हिन्दी
 Čeština
 Українська
 Română

The EUR/USD pair got rejected once again at the major resistance area of 1.1730-1.1760. Price remains inside the triangle pattern. Maybe Thursday after the ECB meeting we could see a break out above or below the triangle that will justify trend continuation lower towards 1.12 or reversal towards 1.20.
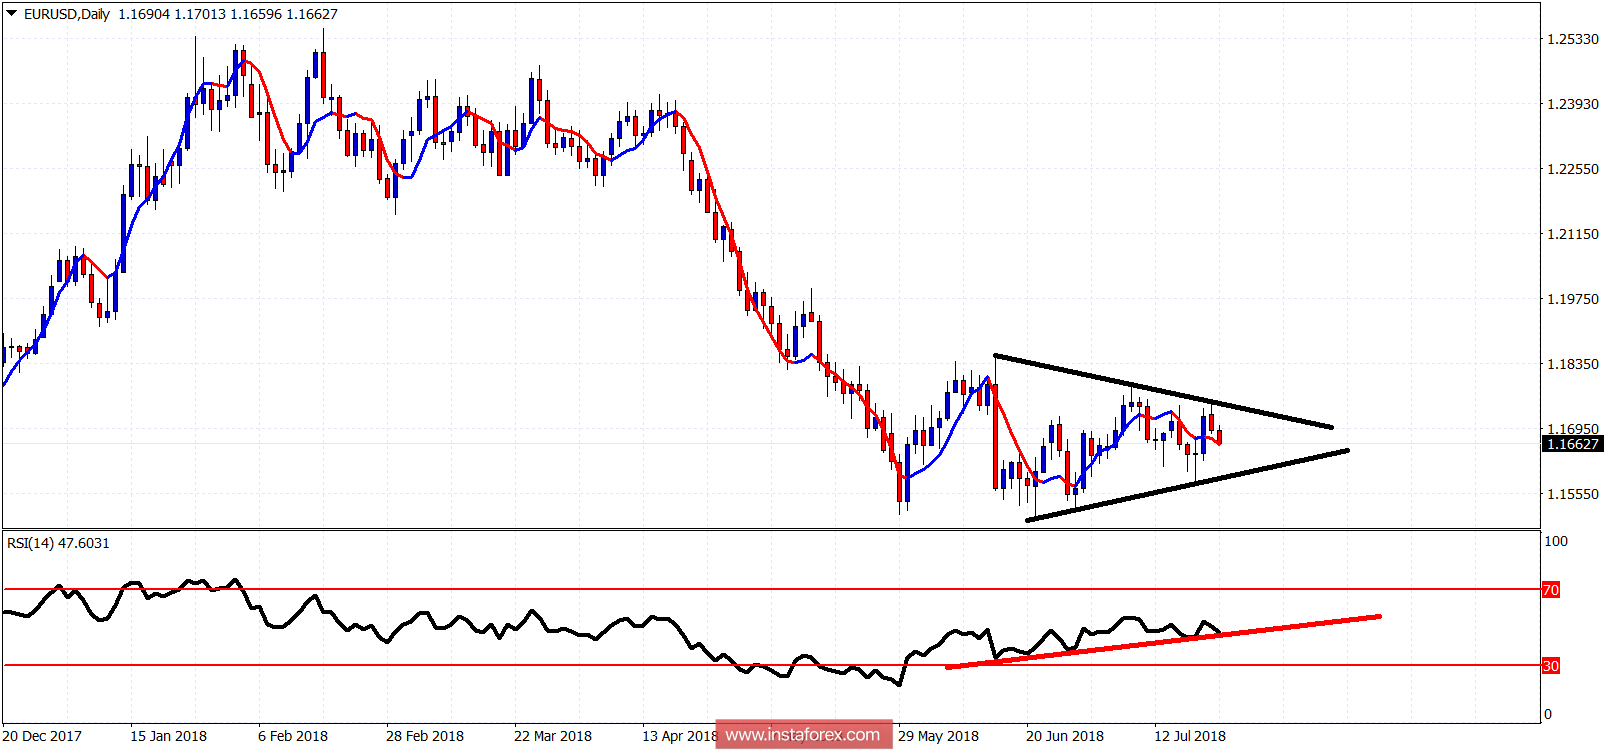
Black lines - triangle pattern
The EUR/USD is in a sideways trend. Resistance remains strong at 1.1730-1.1760. Support is at 1.1590. The RSI is right on support trend line so we could see a bounce from 1.1650 area. A break above 1.1730-1.1760 will open the way for a push towards 1.21. A break below 1.1590 will most probably push the price towards 1.13.