 English
  Русский
 Bahasa Indonesia
 Bahasa Malay
 ไทย
ไทย Español
 Deutsch
 Български
 Français
 Tiếng Việt
 中文
中文 বাংলা
বাংলা हिन्दी
 Čeština
 Українська
 Română

Gold price started the day yesterday by falling below $1,220 only to gradually get back above it and test the short-term resistance of $1,230. The price remains inside the downward sloping wedge pattern.
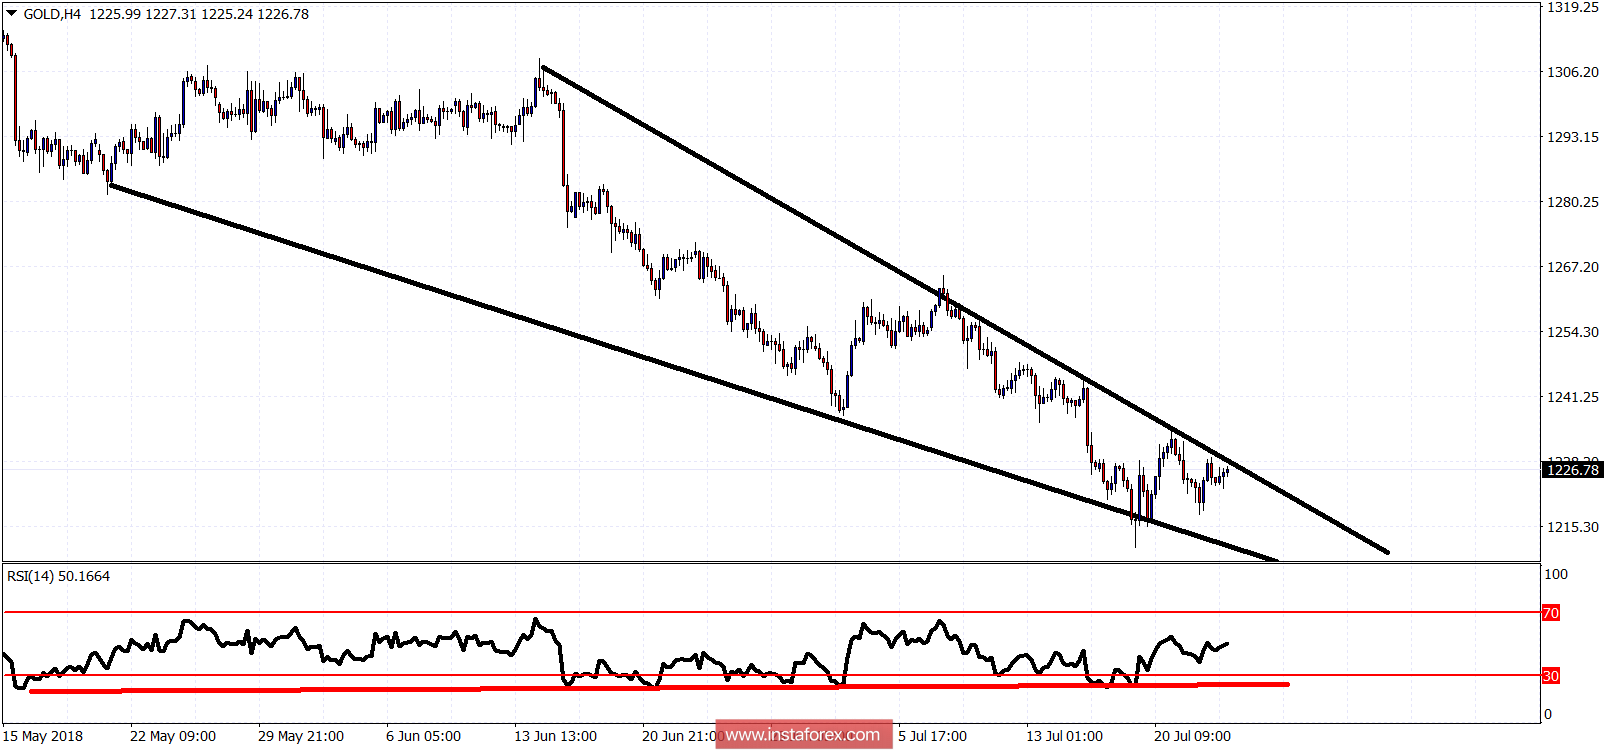
Red line - RSI bullish divergence
Gold price has short-term resistance at $1,230 and next at $1,235. Breaking above these two levels will be a bullish sign as the price will have broken out and above the wedge pattern. Next important short-term resistance will be at $1,245. Trend remains bearish for Gold. Support is at $1,223 and the next one is at $1,218. Breaking below this area will open the way for another new lower low towards $1,200 or even below it.