 English
  Русский
 Bahasa Indonesia
 Bahasa Malay
 ไทย
ไทย Español
 Deutsch
 Български
 Français
 Tiếng Việt
 中文
中文 বাংলা
বাংলা हिन्दी
 Čeština
 Українська
 Română

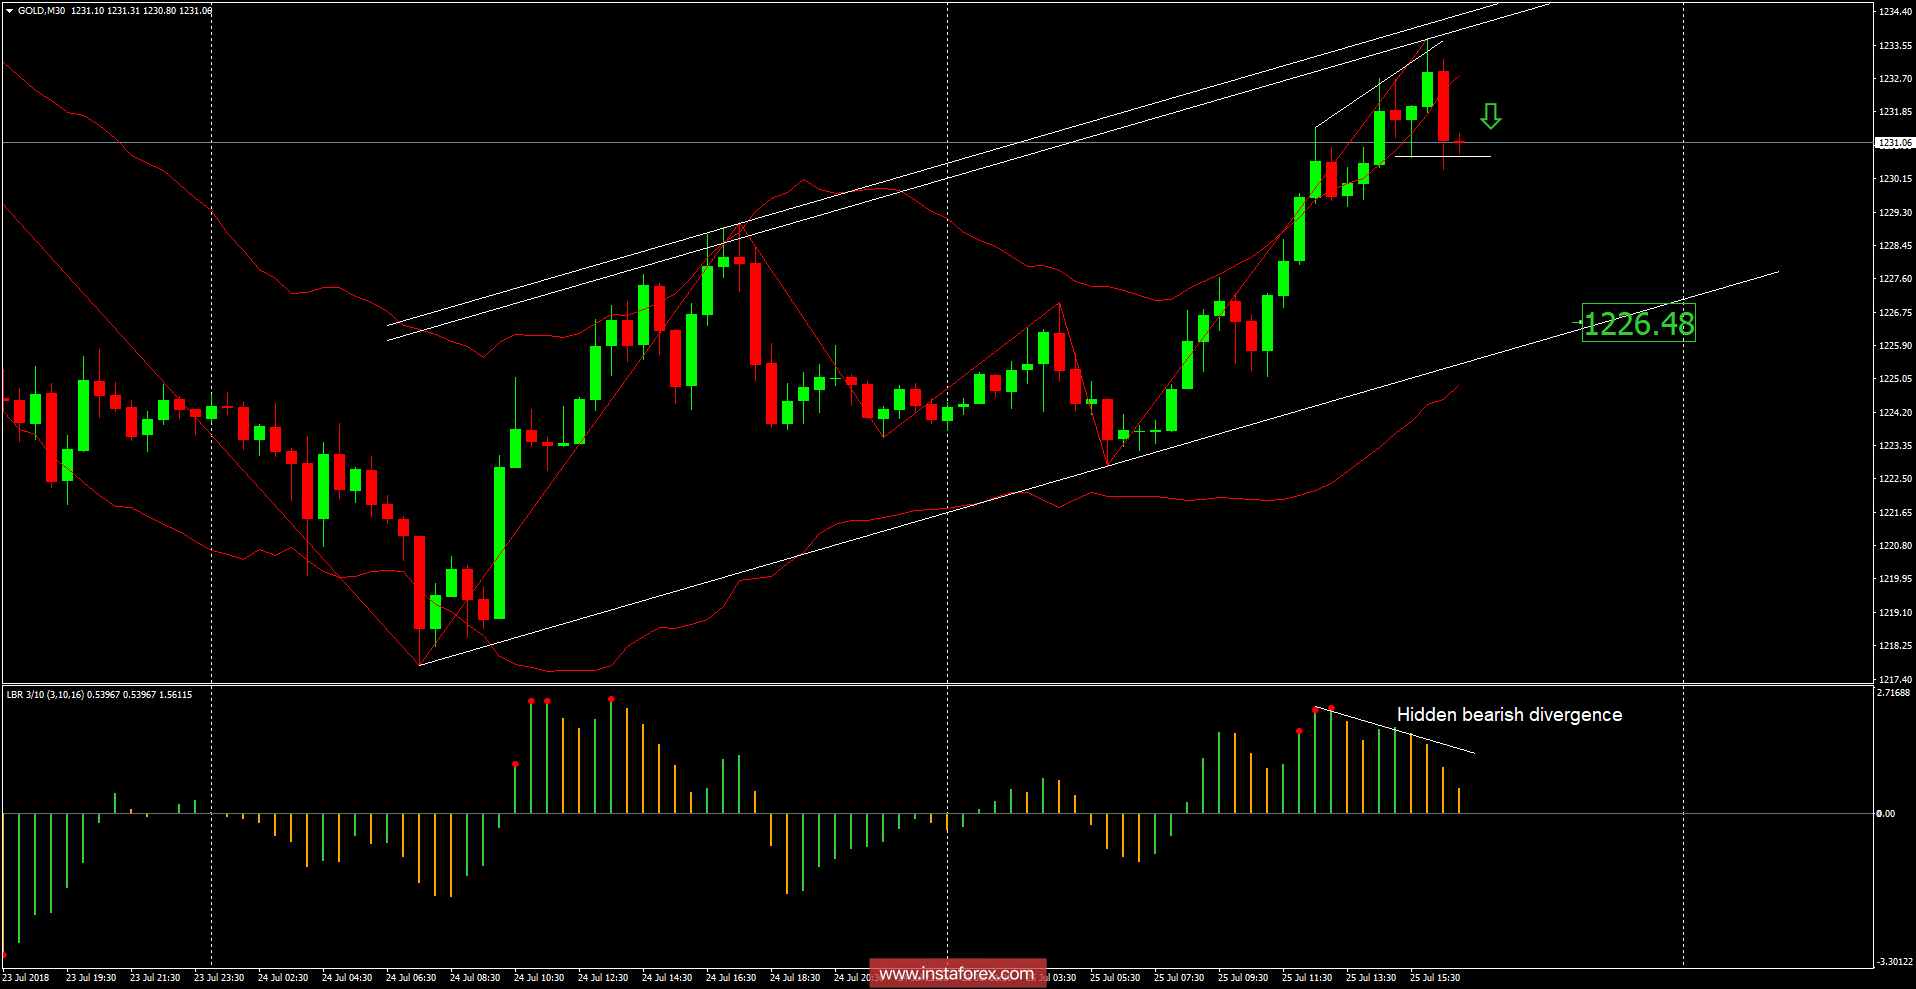
Recently, Gold has been trading upwards. The price tested the level of $1,233.70. Anyway, according to the H1 time – frame, I found a potential end of the upward movement since the price tested the top band of the Keltner channel, which is a sign that buying looks very risky. I also found a bearish engulfing candle pattern, which is another sign that buying looks risky. My advice is to watch for potential selling opportunities. The downward target is set at the price of $1,226.50.
Resistance levels:
R1: $1,230.55
R2: $1,235.75
R3: $1,241.95
Support levels:
S1: $1,219.15
S2: $1,212.97
S3: $1,207.75
Trading recommendations for today: watch for potential selling opportunities.