 English
  Русский
 Bahasa Indonesia
 Bahasa Malay
 ไทย
ไทย Español
 Deutsch
 Български
 Français
 Tiếng Việt
 中文
中文 বাংলা
বাংলা हिन्दी
 Čeština
 Українська
 Română

The Gold price remains inside the downward sloping wedge pattern. The price is right below critical wedge resistance at $1,230-35 area. Only a break above this level will give us a bullish sign that price could reach next resistance level of $1,245-50.
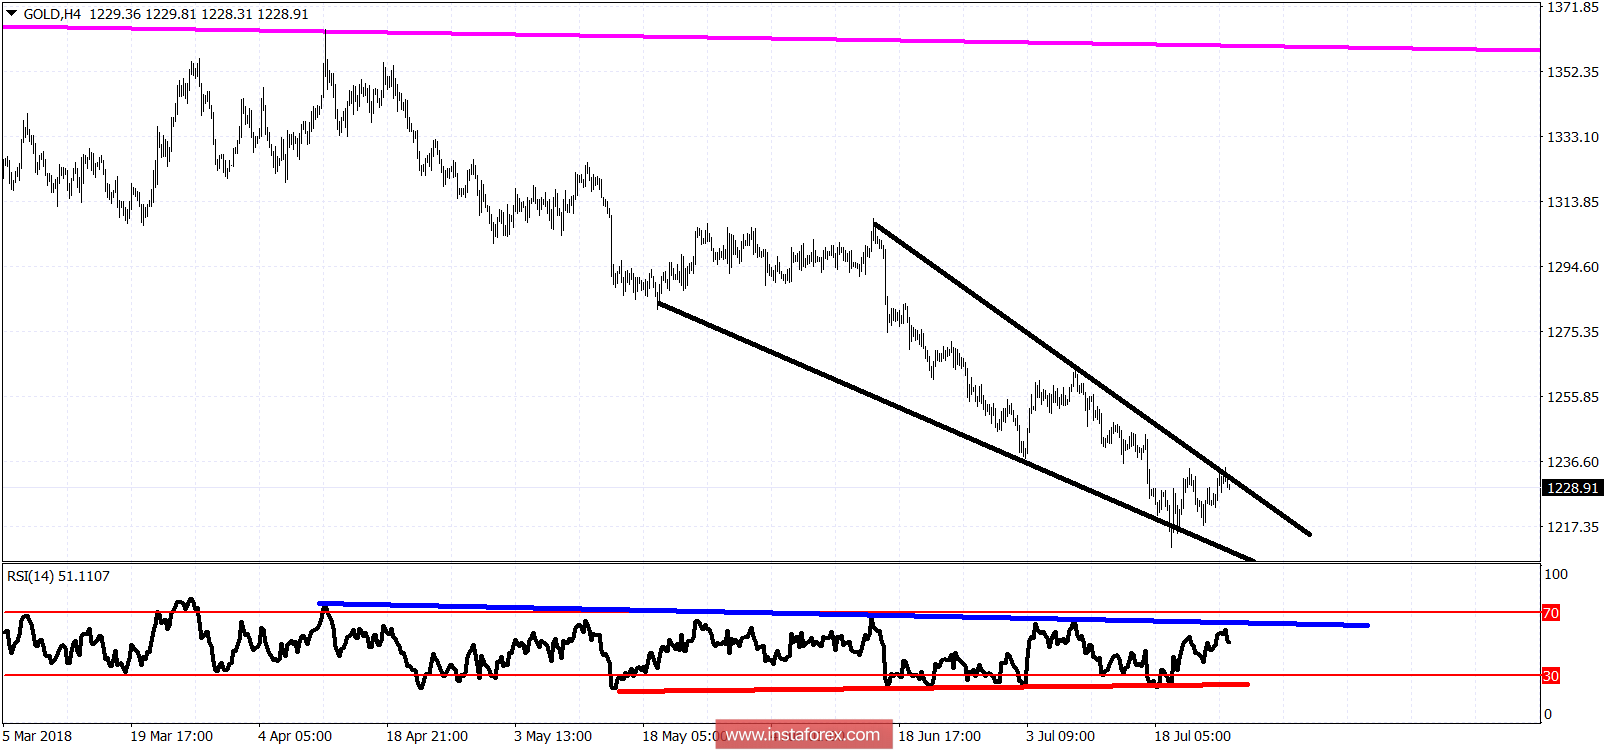
Black lines - wedge pattern
Red line - bullish divergence
Blue line - RSI resistance
The Gold price has short-term support at $1,222 and next at $1,217. However, if $1,222 is broken we will most probably see a move towards $1,200. If resistance at $1,235 is broken we should expect Gold to rally towards $1,245 and higher. A break out above the wedge pattern has many chances of bringing Gold back towards $1,300.