 English
  Русский
 Bahasa Indonesia
 Bahasa Malay
 ไทย
ไทย Español
 Deutsch
 Български
 Français
 Tiếng Việt
 中文
中文 বাংলা
বাংলা हिन्दी
 Čeština
 Українська
 Română

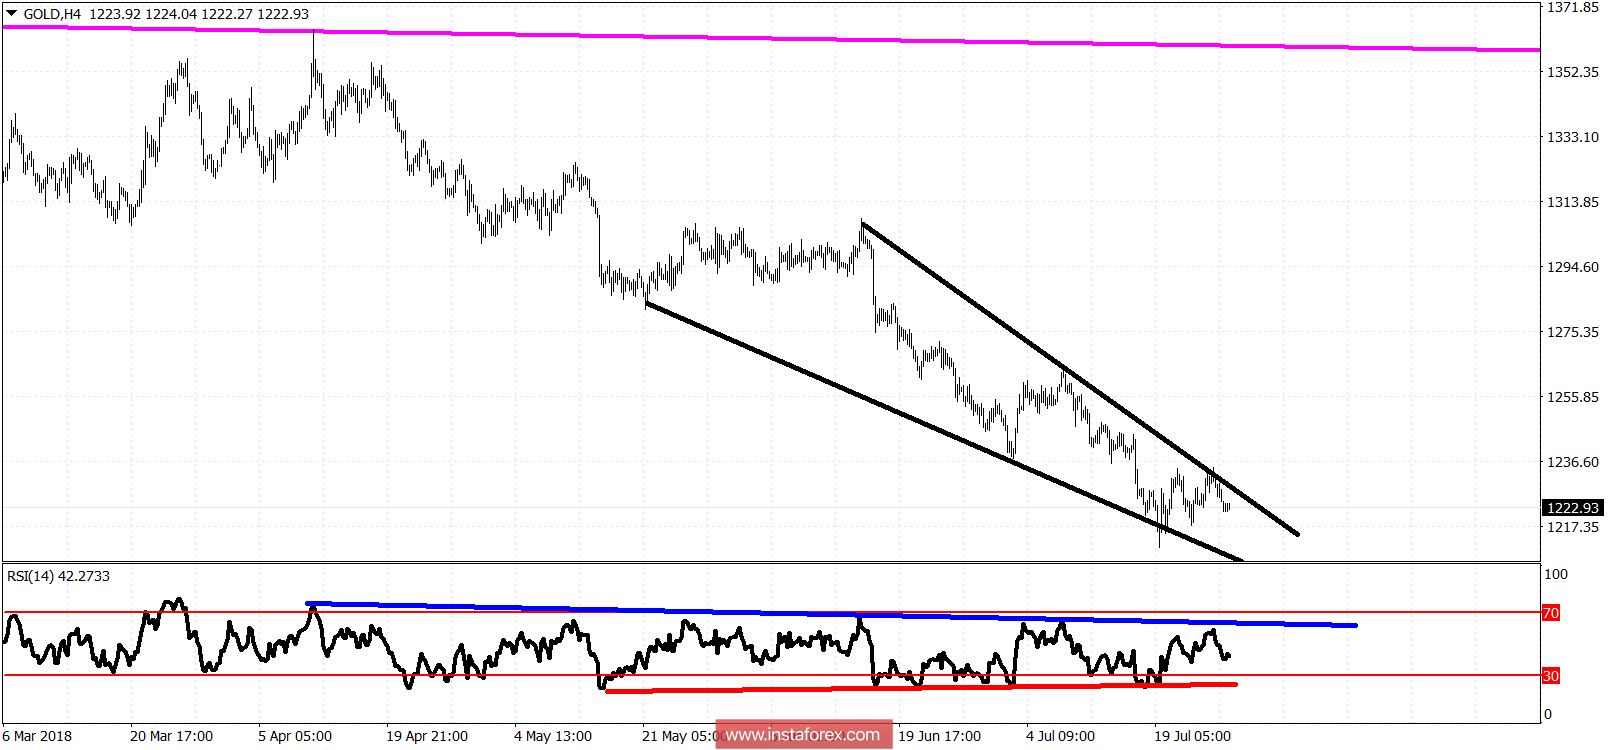
Black lines - downward sloping wedge pattern
Blue line - RSI resistance
Red line - bullish divergence RSI Support
The Gold price could make a new low towards $1,207 where the lower wedge pattern boundary is found. The $1,200-$1,205 area is the next important support. So far trend remains bearish as we see price making lower lows and lower highs. Only a break above $1,235 will change this. The bullish divergence justifies that it is time for a strong bounce but does not guarantee it. We need to break the blue RSI resistance and the $1,235 level first.