 English
  Русский
 Bahasa Indonesia
 Bahasa Malay
 ไทย
ไทย Español
 Deutsch
 Български
 Français
 Tiếng Việt
 中文
中文 বাংলা
বাংলা हिन्दी
 Čeština
 Українська
 Română

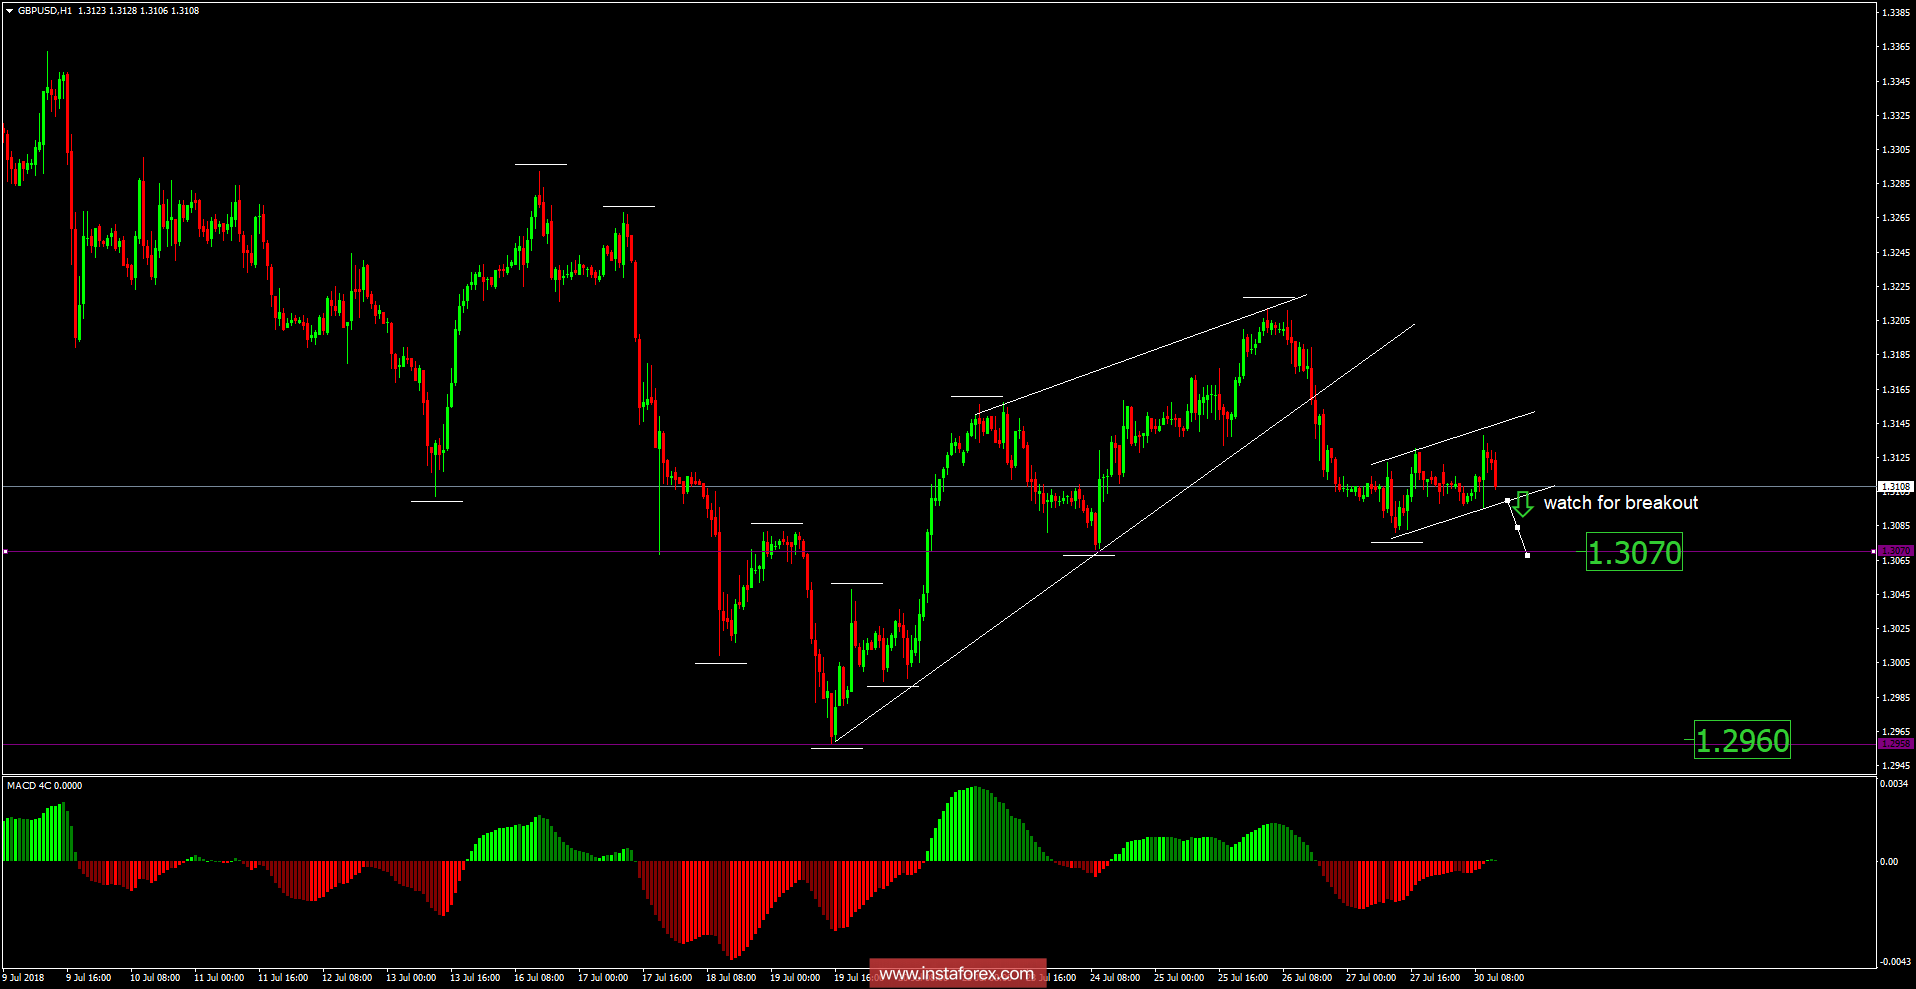
Recently, the GBP/USD pair has been trading sideways at the price of 1.3108. Anyway, according to the H1 time – frame, I found a potential bearish flag pattern in creation, which is sign that buying looks risky. I also found a breakout of the upward trendline in the background, which is another sign of weakness. My advice is to watch for a potential breakout of the bearish flag to confirm further downward continuation. The downward targets are set at the price of 1.3070 and at the price of 1.2960.
Resistance levels:
R1: 1.3120
R2: 1.3129
R3: 1.3137
Support levels:
S1: 1.3103
S2: 1.3095
S3: 1.3086
Trading recommendations for today: watch for potential selling opportunities.