 English
  Русский
 Bahasa Indonesia
 Bahasa Malay
 ไทย
ไทย Español
 Deutsch
 Български
 Français
 Tiếng Việt
 中文
中文 বাংলা
বাংলা हिन्दी
 Čeština
 Українська
 Română

The Gold price remains inside the downward sloping wedge pattern. The price is testing the resistance area at $1,225-26. A sustained break above this area and a continued move higher above $1,235 could be the first sign of a bigger reversal.
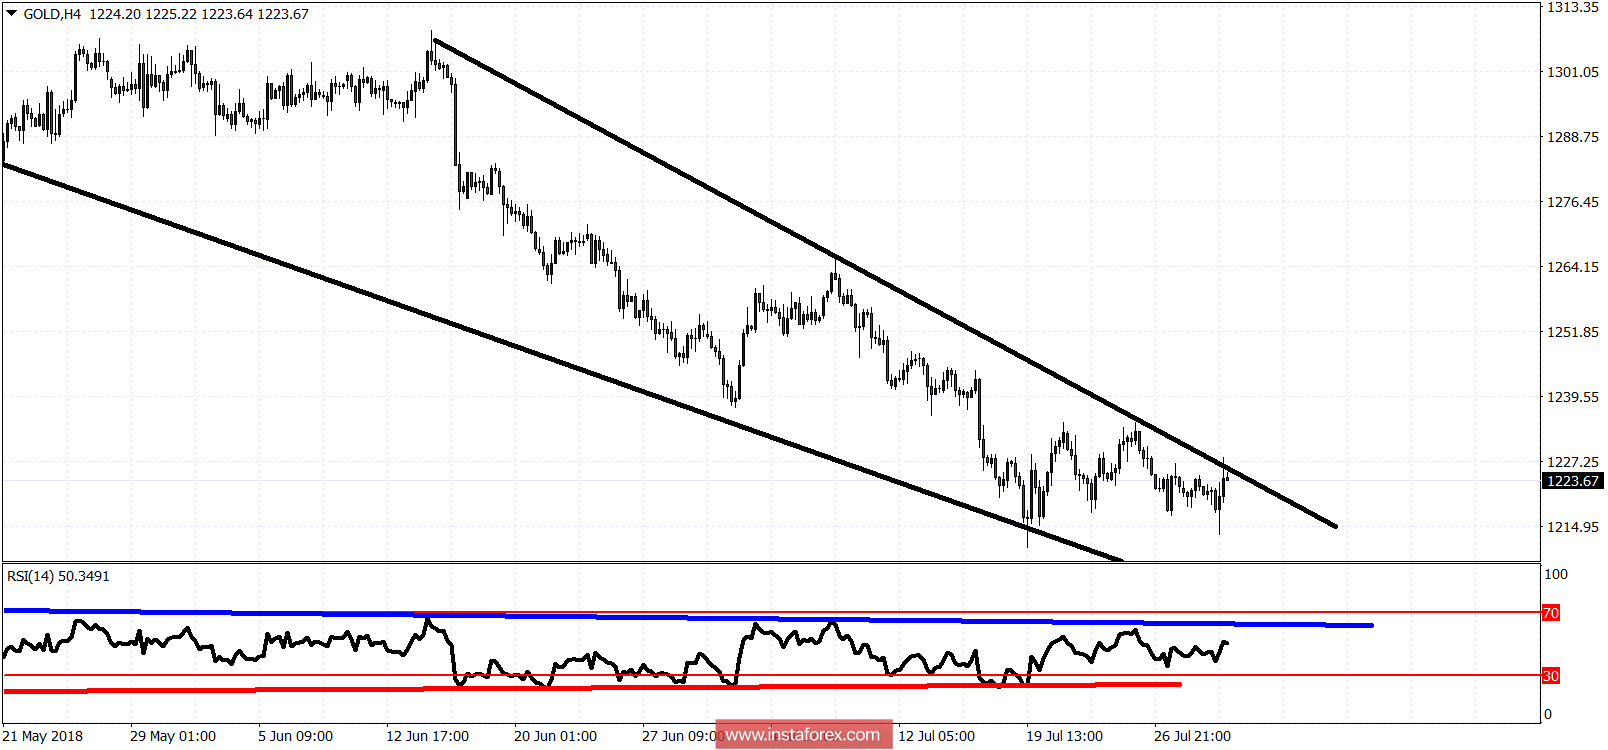
Blue line - RSI resistance
Red line - RSI Support
The Gold price has short-term resistance at $1,225-26. Next and most crucial is at $1,236. Support is at $1,214 and next at $1,200. Break above resistance and we could see $1,300 in the first two weeks of August.