 English
  Русский
 Bahasa Indonesia
 Bahasa Malay
 ไทย
ไทย Español
 Deutsch
 Български
 Français
 Tiếng Việt
 中文
中文 বাংলা
বাংলা हिन्दी
 Čeština
 Українська
 Română

The EUR/USD remains trapped inside the short-term triangle pattern. With a rejection at the upper triangle, boundary prices fell back below 1.17 towards the short-term support at 1.1660. However, the key level for traders and bulls is at 1.16.
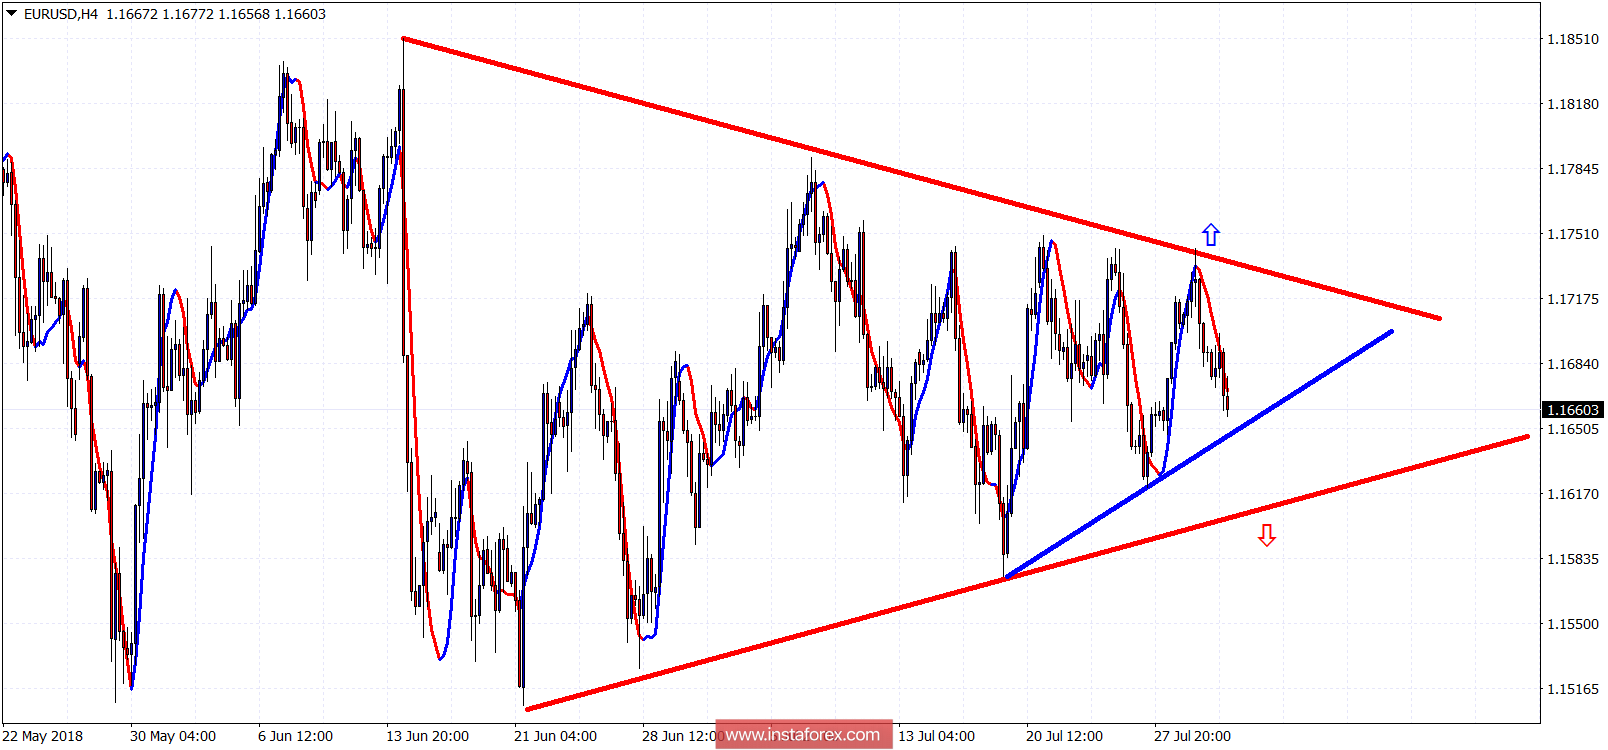
Blue line - short-term support
The EUR/USD has stopped its decline at the short-term support level of 1.1660. Next and most important support level is at 1.16. A daily close below this area will be a big sell signal pushing the pair towards 1.13. On the other hand, bulls need to take control of the trend by breaking above 1.1740-1.1760. For the time being, we continue to buy near support and go short near resistance.