 English
  Русский
 Bahasa Indonesia
 Bahasa Malay
 ไทย
ไทย Español
 Deutsch
 Български
 Français
 Tiếng Việt
 中文
中文 বাংলা
বাংলা हिन्दी
 Čeština
 Українська
 Română

The Gold price is making new lower lows towards $1,204-207 as expected after breaking below $1,217. Support levels are broken one after the other. Gold price remains in a bearish trend, oversold, inside the downward sloping wedge pattern. Next target is at $1,193.
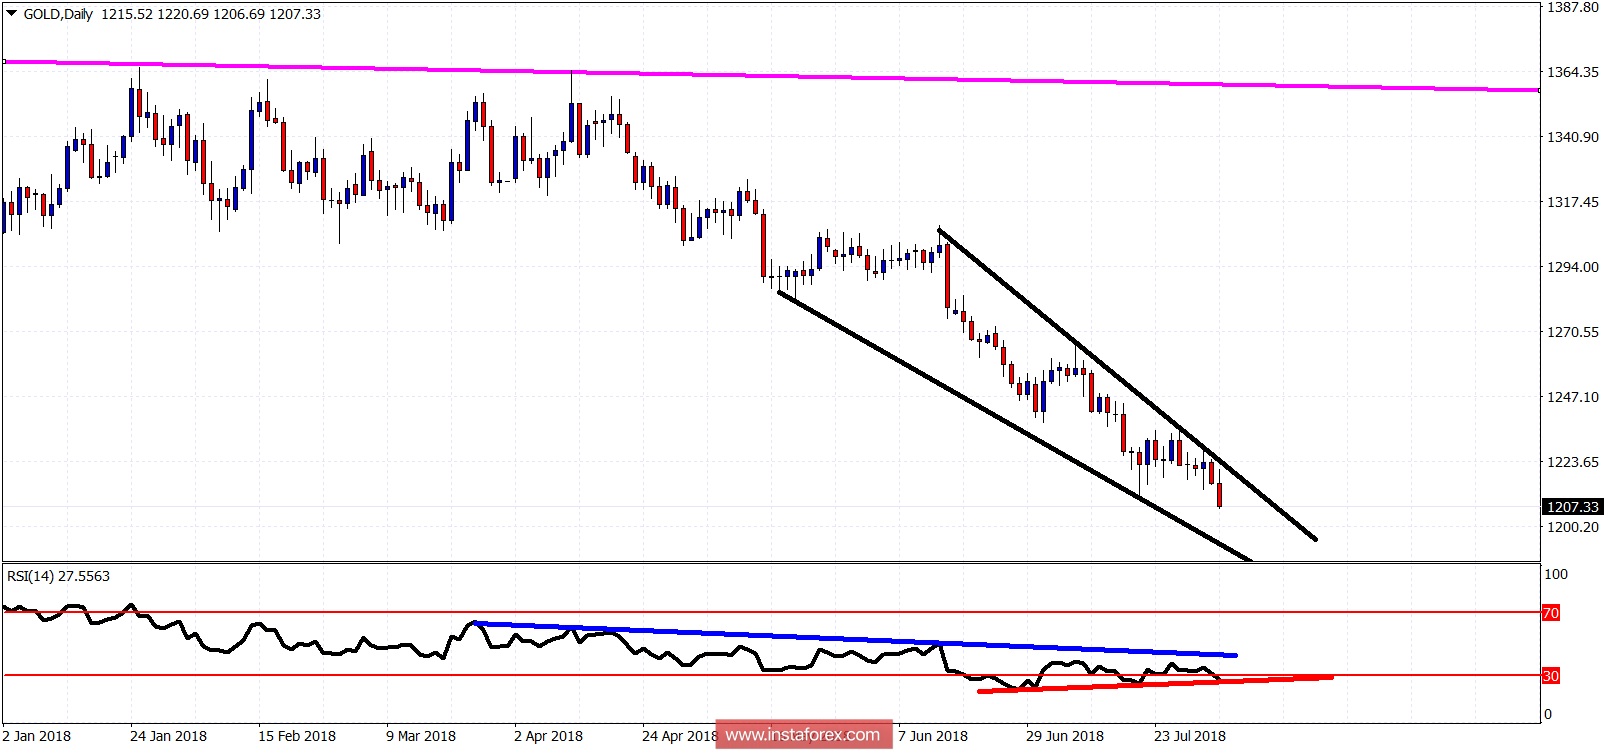
Black lines - wedge pattern
Red line - RSI Support
Blue line - RSI Resistance
The Gold price is making new lows. The Daily RSI is not. This is a bullish divergence. This is a bullish sign. But just a warning for bears. Not a reversal sign. For a reversal, we will first need a break above $1,225-28 area. Next support and the target area is at $1,193.