 English
  Русский
 Bahasa Indonesia
 Bahasa Malay
 ไทย
ไทย Español
 Deutsch
 Български
 Français
 Tiếng Việt
 中文
中文 বাংলা
বাংলা हिन्दी
 Čeština
 Українська
 Română

EUR/USD has broken below the triangle support at 1.16. The price is already below that level following the rejection at the Kumo where we warned bulls for another try to challenge the 1.16 support area. Bulls were warned that as long as the price was below 1.1730-1.1760 trend would be controlled by bears.
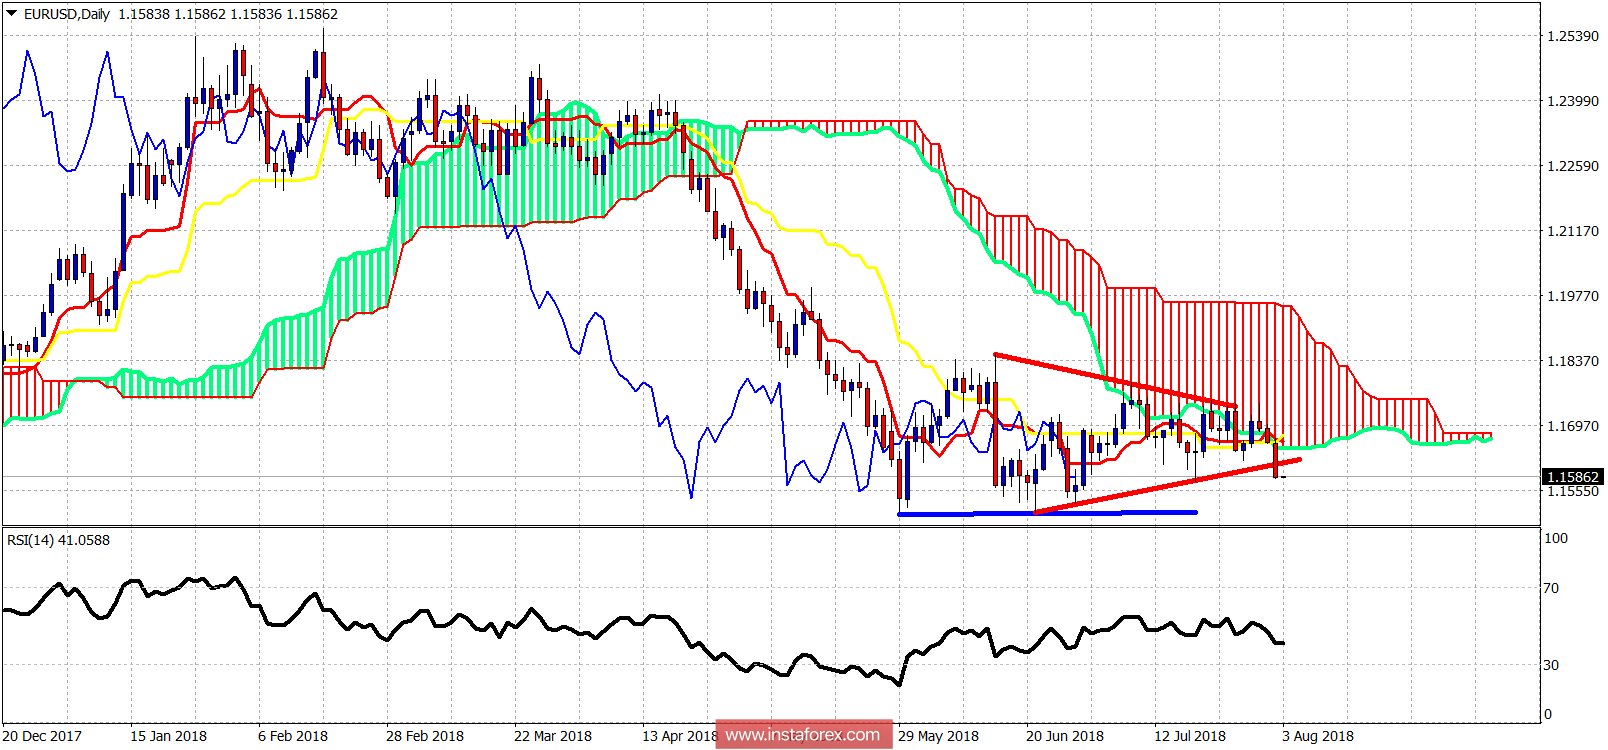
Blue line - important low
The EUR/USD got rejected at the Ichimoku cloud and at the upper triangle boundary. We have been saying that when the price reaches the upper triangle boundary and gets rejected or waits there, we should turn bearish. Only a break above 1.1730-1.1760 would change the trend to bullish. Support is now at 1.15 area. Resistance remains at 1.17-1.1730. Breaking this triangle to the downside is very bearish EUR/USD targeting 1.13-1.12.