 English
  Русский
 Bahasa Indonesia
 Bahasa Malay
 ไทย
ไทย Español
 Deutsch
 Български
 Français
 Tiếng Việt
 中文
中文 বাংলা
বাংলা हिन्दी
 Čeština
 Українська
 Română

Gold price remains inside the downward sloping wedge pattern. The trend remains bearish. Gold price is making lower lows and lower highs. The RSI continues to provide bullish divergence warnings. The key short-term reversal level has now been lowered.
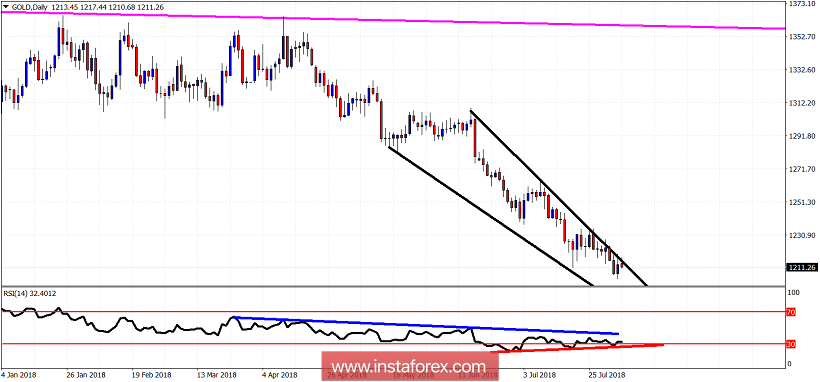
Red line - RSI bullish divergence
Blue line- RSI resistance
As long as the price is below $1,225 and the RSI is below the blue trend line resistance, the trend will remain bearish. For the short-term trend to change to bullish we need to see both levels to be broken upwards. The next support in gold price is at $1,190-$1,180. The price behavior justifies a strong bounce at least towards $1,265-75 area.