 English
  Русский
 Bahasa Indonesia
 Bahasa Malay
 ไทย
ไทย Español
 Deutsch
 Български
 Français
 Tiếng Việt
 中文
中文 বাংলা
বাংলা हिन्दी
 Čeština
 Українська
 Română

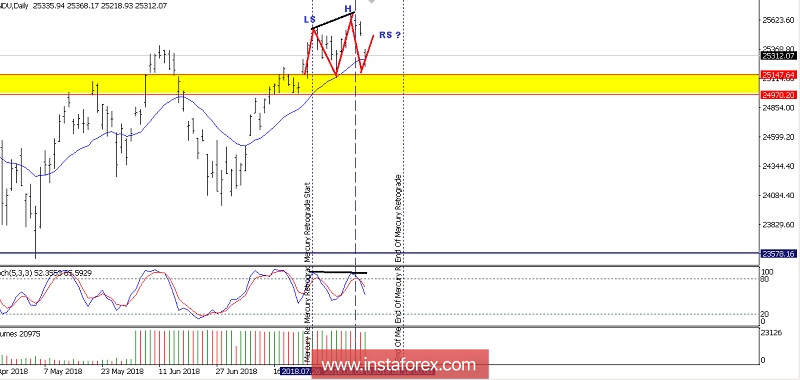
Last week, the Dow Jones index made a gap during the crisis in Turkey because too many investor want to distribute their funds into safe heaven assets such the USD$. If we look at the daily chart, the index seems to have made a Head And Shoulders Pattern. Just watch the 24,970.20 level. If this level can be breached, the odds are that the Dow Jones will change its current trend into the bearish bias.
(Disclaimer)