 English
  Русский
 Bahasa Indonesia
 Bahasa Malay
 ไทย
ไทย Español
 Deutsch
 Български
 Français
 Tiếng Việt
 中文
中文 বাংলা
বাংলা हिन्दी
 Čeština
 Українська
 Română

EUR/USD remains in a bearish trend. Price has broken below the critical 1.15 May lows and as the expected price is moving towards 1.13. We are bearish since the rejections and triangle pattern at the 1.1730-1.1760 area. The inability to break above resistance eventually lead to the break below support.
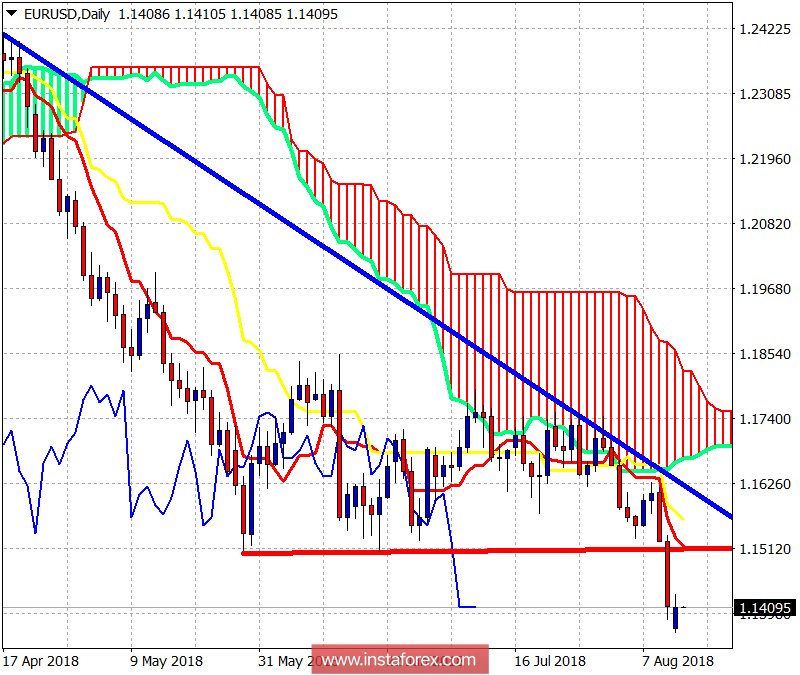
Red line - medium-term resistance (previous support)
The EUR/USD is trying to bounce above 1.14. We could see a back test of the broken red trend line support at 1.15 which is now important resistance. Not shown above, but the Daily RSI is giving bullish divergence signs. Big short-term resistance is found at 1.15-1.1520. So a daily close above this area could signal a bigger bounce and a fake break down. Otherwise we expect a move lower towards 1.12.