 English
  Русский
 Bahasa Indonesia
 Bahasa Malay
 ไทย
ไทย Español
 Deutsch
 Български
 Français
 Tiếng Việt
 中文
中文 বাংলা
বাংলা हिन्दी
 Čeština
 Українська
 Română

The Gold price gave us a reversal formation in the daily chart. The Gold price could have made a short-term bottom and we should expect the Gold price to bounce at least towards $1,190-$1,210 area. Gold bulls should feel more comfortable on a break above $1,183.
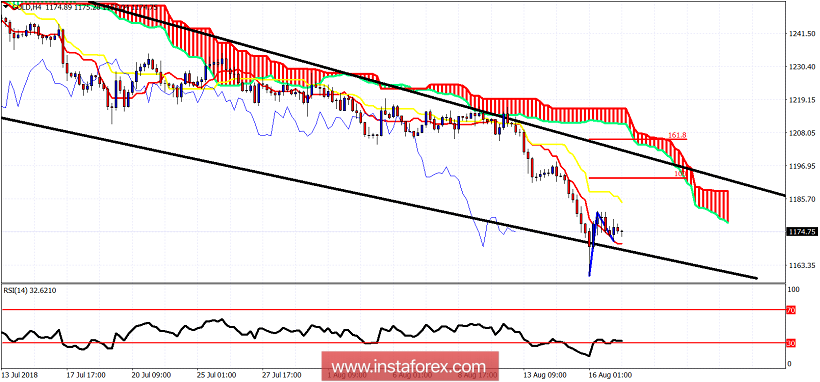
The Gold price remains in a bearish trend below the Ichimoku cloud and inside the wedge pattern. The Gold price made a reversal pattern yesterday and with short-term resistance at $1,183, a break above it will open the way for a bounce towards $1,193 first or towards $1,205. The upper wedge boundary and the Ichimoku cloud is an important trend resistance. Support is at $1,160.