 English
  Русский
 Bahasa Indonesia
 Bahasa Malay
 ไทย
ไทย Español
 Deutsch
 Български
 Français
 Tiếng Việt
 中文
中文 বাংলা
বাংলা हिन्दी
 Čeština
 Українська
 Română

EUR/USD plan remains unchanged to our last analysis. The price remains above short-term support of 1.1350 and we expect prices to move towards the previous support level and now resistance at 1.15 and close to the Ichimoku cloud resistance.
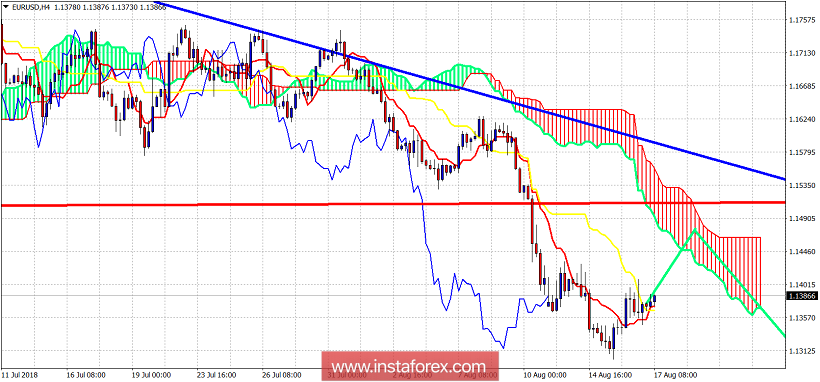
Blue line - downward sloping trend line resistance
Green lines - expectation
EUR/USD is holding above the tenkan-sen (red line indicator) while the tenkan-sen is breaking above the kijun-sen (yellow line indicator). This is a weak bullish sign, that justifies a bounce towards 1.1450-1.15. The trend remains bearish in the medium-term and will remain bearish as long as the price is below 1.1570-1.16.