 English
  Русский
 Bahasa Indonesia
 Bahasa Malay
 ไทย
ไทย Español
 Deutsch
 Български
 Français
 Tiếng Việt
 中文
中文 বাংলা
বাংলা हिन्दी
 Čeština
 Українська
 Română

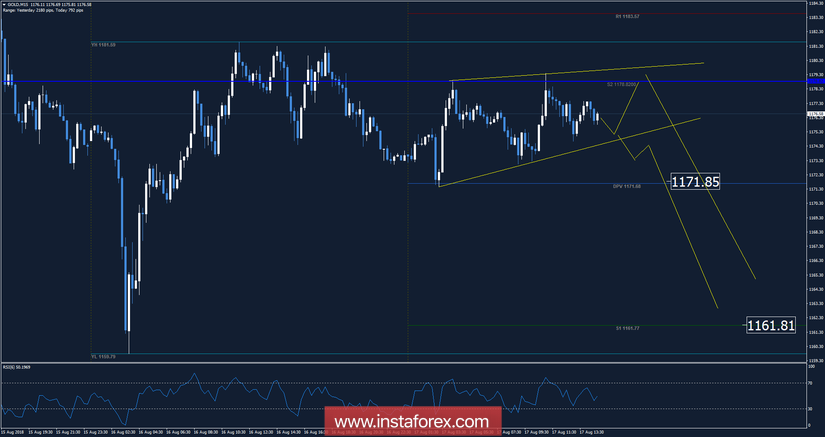
Recently, Gold has been trading sideways at the price of $1,176.15. According to the M15 time – frame, I found that Gold is in a consolidation phase and a potential rising wedge is in progress, which is a sign that buying looks risky. The price also broke the monthly S2 support in the background, which is another sign of the downward pressure. My advice is to watch for a otential breakout of the support trendline to confirm further downward continuation. The downward targets are set at the price of $1,171.85 and at the price of $1,161.80.
Resistance levels:
R1: $1,183.57
R2: $1,193.45
R3: $1,205.37
Support levels:
S1: $1,161.75
S2: $1,149.85
S3: $1,139.95
Trading recommendations for today: watch for potential selling opportunities.