 English
  Русский
 Bahasa Indonesia
 Bahasa Malay
 ไทย
ไทย Español
 Deutsch
 Български
 Français
 Tiếng Việt
 中文
中文 বাংলা
বাংলা हिन्दी
 Čeština
 Українська
 Română

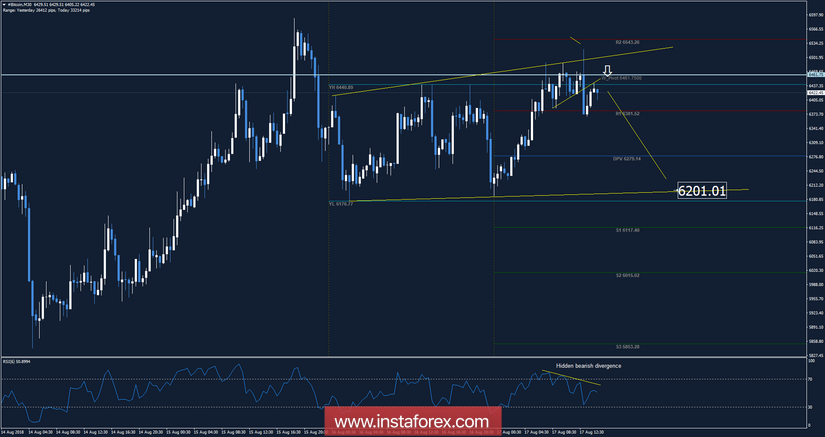
Trading recommendations:
According to the 30M time frame, I found that price did fake breakout of the yesterday's high at the level of $6,440, which is a sign that buying looks risky. I also found a weekly pivot at $6,641 and a hidden bearish divergence on the RSI oscillator, which is another sign of weakness. My advice is to watch for potential selling opportunities. The downward target is set at the price of $6,200.
Support/Resistance
$6,520 – Intraday resistance
$6,380– Intraday support
$6,200 – Objective target
With InstaForex you can earn on cryptocurrency's movements right now. Just open a deal in your MetaTrader4.