 English
  Русский
 Bahasa Indonesia
 Bahasa Malay
 ไทย
ไทย Español
 Deutsch
 Български
 Français
 Tiếng Việt
 中文
中文 বাংলা
বাংলা हिन्दी
 Čeština
 Українська
 Română

EUR/USD has formed an inverted head and shoulders pattern. This pattern is activated on a break above the neckline resistance at recent highs at 1.1640-1.1650. This pattern if activated will give us target around 1.1930.
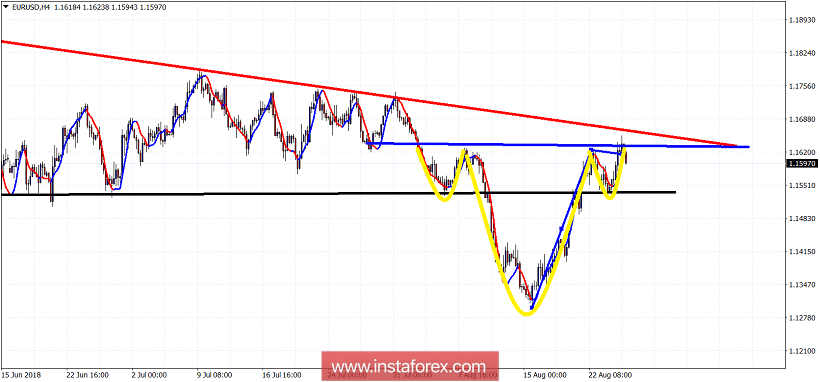
Blue line - neckline resistance
Yellow lines - Inverted Head and shoulders pattern
Black line - support
Support is at 1.1530. A break below this level will cancel the bullish inverted H&S pattern. Bulls will have two supporting signals on a break above 1.1630-1.1650 as price will be activating the Inverted H&S pattern and will also be breaking above the red trend line resistance. EUR/USD has made a new high but the RSI does not confirm it (not shown here). This is a worrying sign so despite the bullish pattern we have noted, a break below the black support line will bring bears back in control and will cancel the short-term bullish view.