 English
  Русский
 Bahasa Indonesia
 Bahasa Malay
 ไทย
ไทย Español
 Deutsch
 Български
 Français
 Tiếng Việt
 中文
中文 বাংলা
বাংলা हिन्दी
 Čeština
 Українська
 Română

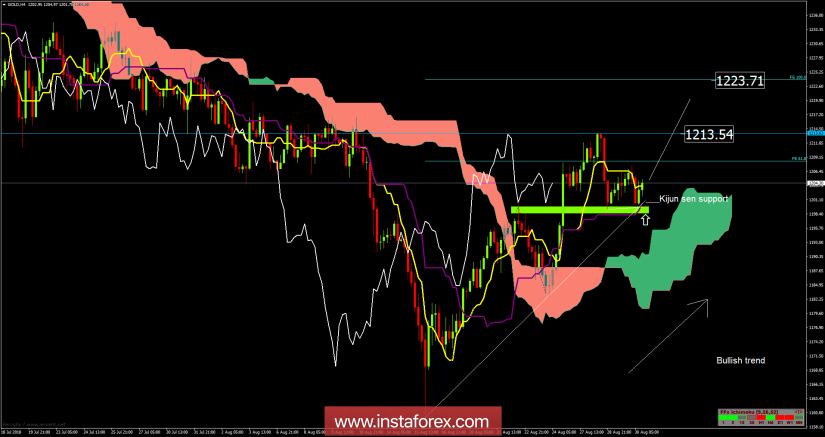
Recently, Gold has been trading sideways at the price of $1,204.50. According to the H4 time – frame, I saw that Gold found the multiply support at the price of $1,200.00. There I found the Kijun-sen, upward trendline and the previous high. The short-term trend is bullish (rising Ichimoku cloud) and my advice is to watch for potential buying opportunities. I have placed Fibonacci expansion to find potential upward target. I got Fibonacci expansion 100% at the price of $1,223.70. The first upward target is set at the price of $1,213.55 (previous swing high).
Key Support Kijun-sen (purple line) – $1,200.00
Trading recommendations for today : As long the price is holding above the Kijun-sen on the H4 time – frame, watch for buying opportunities.