 English
  Русский
 Bahasa Indonesia
 Bahasa Malay
 ไทย
ไทย Español
 Deutsch
 Български
 Français
 Tiếng Việt
 中文
中文 বাংলা
বাংলা हिन्दी
 Čeština
 Українська
 Română

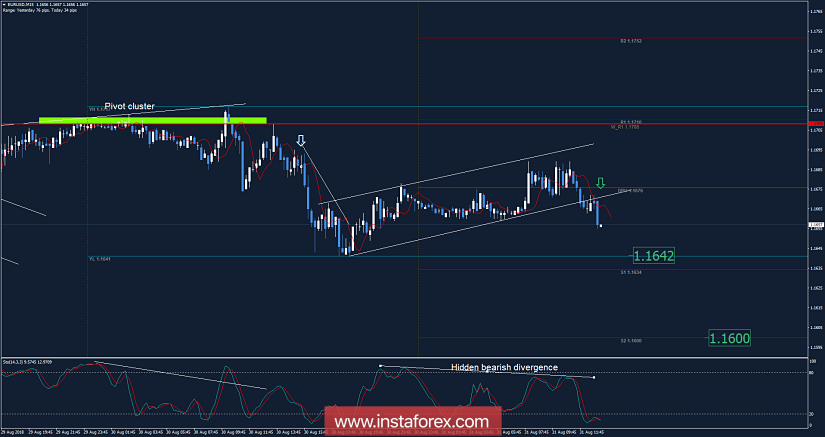
Recently, the EUR/USD pair has been trading sideways at the price of 1.1660. According to the M15 time – frame, I found the breakout of the bearish flag pattern (bearish pattern), which is a sign that sellers are in control and that buying looks risky. I also found a hidden bearish divergence on the stochastic oscillator, which is another sign of weakness. My advice is to watch for potential selling opportunities. The downward targets are set at the price of 1.1642 and at the price of 1.1600.
Resistance levels:
R1: 1.1710
R2: 1.1752
R3: 1.1786
Support levels:
S1: 1.1634
S2: 1.1600
S3: 1.1558
Trading recommendations for today: watch for potential selling opportunities.