 English
  Русский
 Bahasa Indonesia
 Bahasa Malay
 ไทย
ไทย Español
 Deutsch
 Български
 Français
 Tiếng Việt
 中文
中文 বাংলা
বাংলা हिन्दी
 Čeština
 Українська
 Română

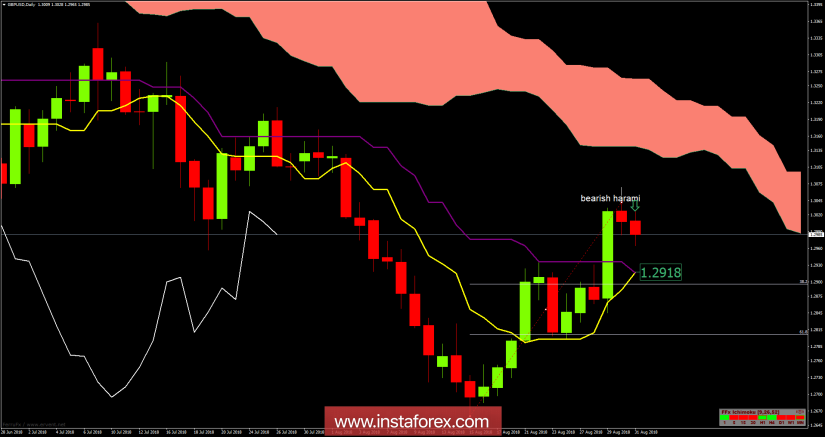
Recently, the GBP/USD pair has been trading sideways at the price of 1.3000. According to the Daily time – frame, I found a bearish harami candlestick pattern in the background, which is a sign that buying looks risky and that selling might be the right play. The price is trading below the cloud, which is a sign that trend is downward. Watch for selling opportunities. The downward target is set at the price of 1.2918 (kijun-sen + tankan-sen).
Key resistance – 1.3042
Support and downward target – 1.2918 (Kijun sen + Tenkan sen)
Trading recommendations for today: watch for potential selling opportunities.