EUR/USD has pulled back towards 1.16 and lower as we expected. Price is now challenging important short-term cloud support. This pull back could already be over and we could see another leg higher starting in EUR/USD. For this to be true price will need to break above the cloud and stay above it.
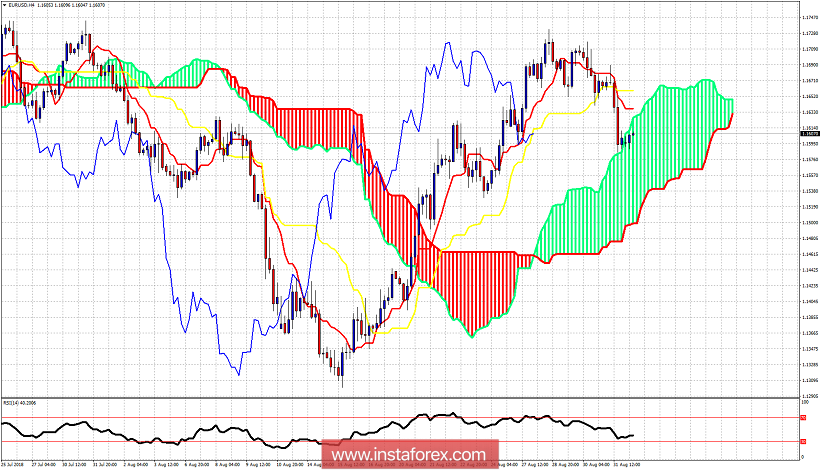
EUR/USD has short-term support the recent lows at 1.1588. A break below this level will push price towards the lower cloud boundary at 1.1540. Short-term resistance is at 1.1630 and at 1.1660 by the kijun-sen (yellow line indicator). As long as the 4-hour chart shows prices closing below the kijun-sen, we should be expecting another leg down. EUR/USD could make a base at current levels and bounce off the cloud support. However, the longer price stays inside the Kumo (cloud) the chances of another leg down increase.
*The market analysis posted here is meant to increase your awareness, but not to give instructions to make a trade
 English
  Русский
 Bahasa Indonesia
 Bahasa Malay
 ไทย
ไทย Español
 Deutsch
 Български
 Français
 Tiếng Việt
 中文
中文 বাংলা
বাংলা हिन्दी
 Čeština
 Українська
 Română
