 English
  Русский
 Bahasa Indonesia
 Bahasa Malay
 ไทย
ไทย Español
 Deutsch
 Български
 Français
 Tiếng Việt
 中文
中文 বাংলা
বাংলা हिन्दी
 Čeština
 Українська
 Română

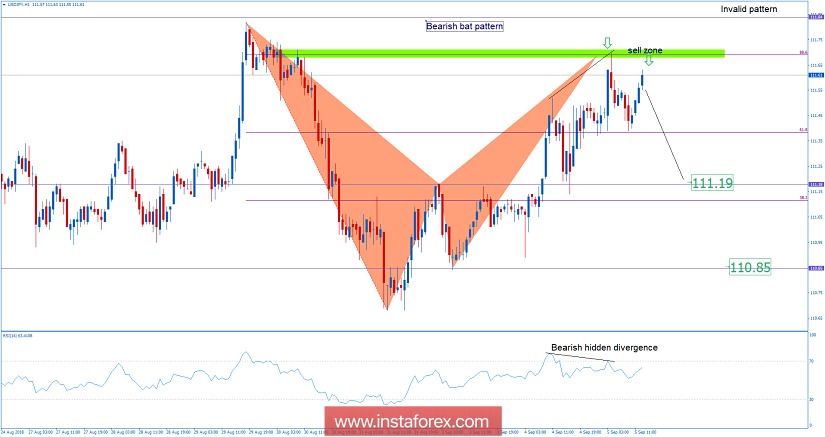
Recently, the USD/JPY pair has been trading upwards. The price tested my key resistance sell zone at 111.70 (Fibonacci retracement 88.6%). I found completed a bearish bat pattern, which is a legit bearish opportunity. I also found a hidden bearish divergence on the RSI (14) oscillator, which is another sign of weakness. Watch for selling opportunities with the downward targets at the price of 111.19 and at the price of 110.85. Pattern will be invalid if the price breaks the level of 111.84.