 English
  Русский
 Bahasa Indonesia
 Bahasa Malay
 ไทย
ไทย Español
 Deutsch
 Български
 Français
 Tiếng Việt
 中文
中文 বাংলা
বাংলা हिन्दी
 Čeština
 Українська
 Română

Gold price continues to move sideways between $1,210 and $1,190. Trend is bearish as price remains below the Daily Kumo. Price is also trapped between the kijun- and tenkan-sen indicators.
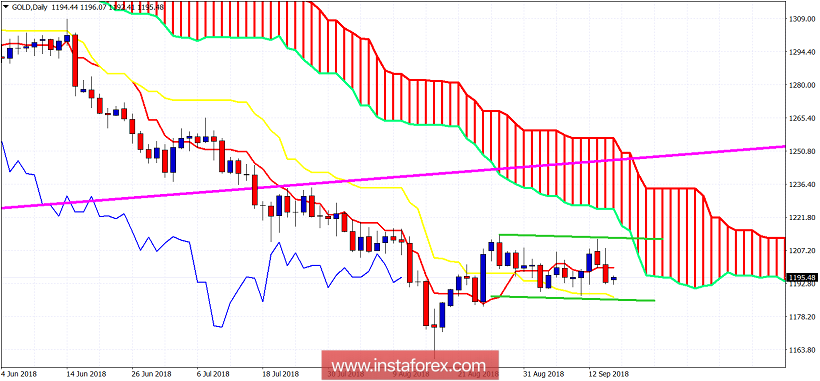
Gold price could bounce today towards the upper range boundary at $1,213 where we also find the Daily cloud resistance. Short-term support remains at $1,190-87 area. A daily close below this level will open the way for a push to new lows towards $1,140-$1,100.I prefer to be patient and wait for a bounce to sell Gold as I believe a test of cloud resistance will be seen soon and a rejection will follow. Only a break above the Daily Kumo will change the medium-term trend in Gold.