 English
  Русский
 Bahasa Indonesia
 Bahasa Malay
 ไทย
ไทย Español
 Deutsch
 Български
 Français
 Tiếng Việt
 中文
中文 বাংলা
বাংলা हिन्दी
 Čeština
 Українська
 Română

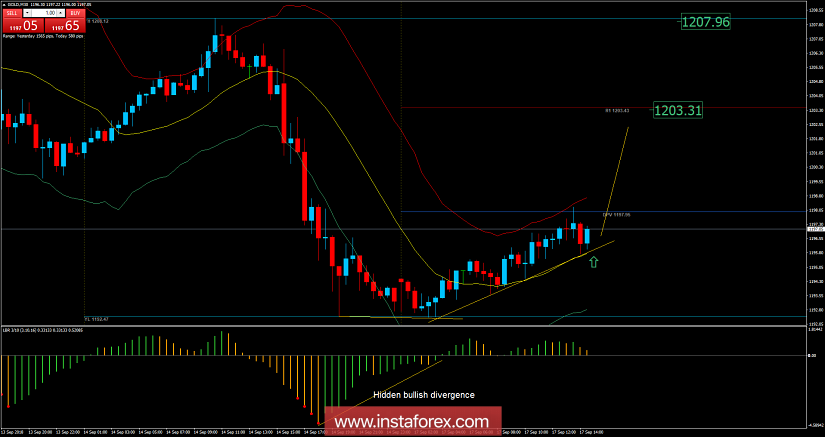
Recently, Gold has been trading upwards. The price tested the level of $1,198.20 (daily pivot). According to the M30 time – frame, I found a hidden bullish divergence on the the 3/10 oscillator in the background, which is a sign that selling looks risky. I also found that price rejecting from the upward trendline, which is a sign that buyers are in control. My advice is to watch for buying opportunities. The upward targets are set at the price of $1,203.30 and at the price of $1,207.95.