 English
  Русский
 Bahasa Indonesia
 Bahasa Malay
 ไทย
ไทย Español
 Deutsch
 Български
 Français
 Tiếng Việt
 中文
中文 বাংলা
বাংলা हिन्दी
 Čeština
 Українська
 Română

Gold price got rejected at the $1,210 resistance and broke below $1,200. We warned last week that prices were testing the important upper channel and previous highs at $1,211 and the danger of a rejection was high. The rejection and the break below $1,200 was a very bearish sign.
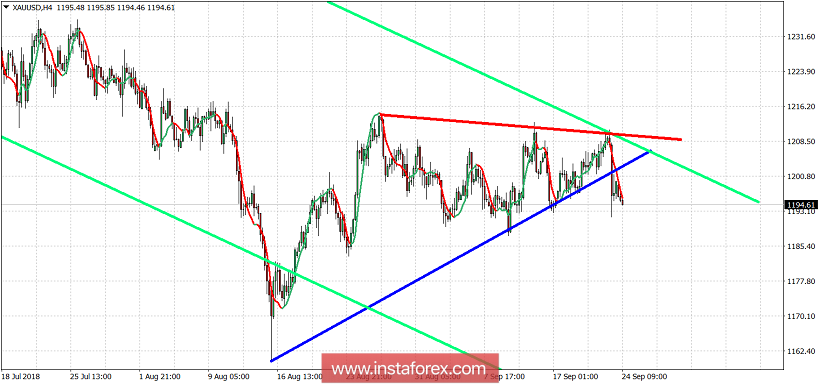
Green lines - bearish channel
Blue line - support trend line (broken)
Gold bulls are in a difficult spot. Price got rejected and broke below the support trend line. Next support is at $1,180. Resistance is at $1,208-10. Gold price is still inside the bearish channel. Trend remains bearish. Gold could see a move below $1,190-80 over the coming weeks as long as price is below $1,210.