 English
  Русский
 Bahasa Indonesia
 Bahasa Malay
 ไทย
ไทย Español
 Deutsch
 Български
 Français
 Tiếng Việt
 中文
中文 বাংলা
বাংলা हिन्दी
 Čeština
 Українська
 Română

Gold price continues to trade around $1,200. Price bounced off the $1,192 low towards $1,203 as a back test of the broken resistance and got rejected. Gold bulls need to break above $1,211 for a move higher. As long as price is below that level, they are in danger of seeing another sell off.
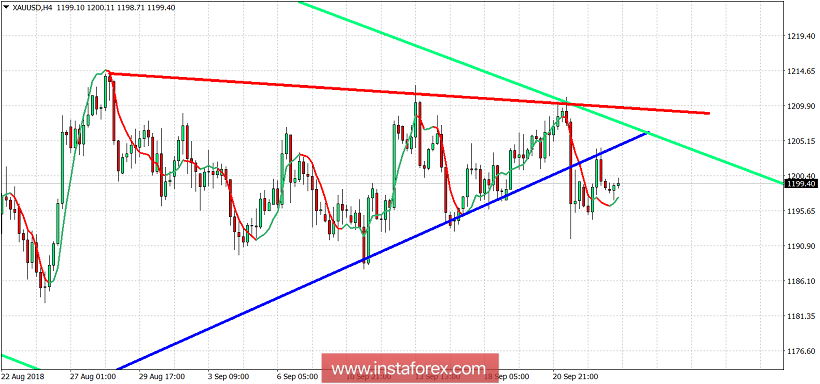
Blue line - support (broken)
Green lines - bearish channel
Gold price has short-term resistance at $1,205. Channel resistance is at $1,207 and the trend line resistance touching previous highs is also at $1,210. So the area between $1,205-$1,210 is an important resistance area and as long as price is below it, I expect another strong sell off that will eventually break $1,180. Support is at recent lows of $1,192. Breaking it of course would be a sign of weakness.