 English
  Русский
 Bahasa Indonesia
 Bahasa Malay
 ไทย
ไทย Español
 Deutsch
 Български
 Français
 Tiếng Việt
 中文
中文 বাংলা
বাংলা हिन्दी
 Čeština
 Українська
 Română

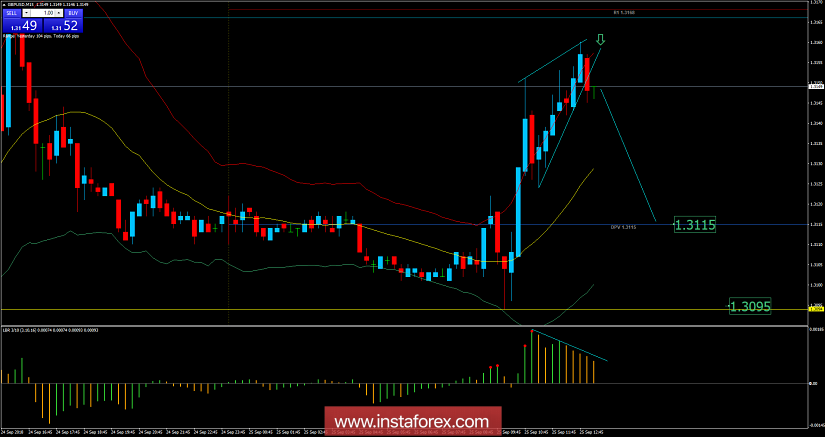
Recently, the GBP/USD pair has been trading upwards. The price tested the level of 1.3160. Anyway, according to the M15 time – frame, I found a breakout of the intraday support trendline, which is a sign that buying looks risky. I also found a hidden bearish divergence on the LBR 3/10 oscillator, which is another sign of weakness. My advice is to watch for selling opportunities. The downward targets are set at the price of 1.3115 (daily pivot) and at the price of 1.3095 (current daily low).