 English
  Русский
 Bahasa Indonesia
 Bahasa Malay
 ไทย
ไทย Español
 Deutsch
 Български
 Français
 Tiếng Việt
 中文
中文 বাংলা
বাংলা हिन्दी
 Čeština
 Українська
 Română

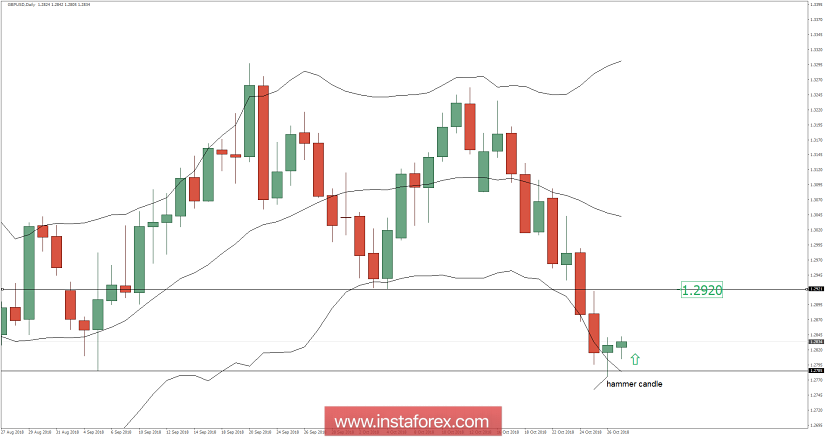
Recently, the GBP/USD pair has been trading sideways at the price of 1.2836. Anyway, according to the daily time – frame, I have found a hammer candle (bullish) and rejection from the lower band (Bollinger band), which is a sign that selling looks risky. I have also found today that that higher high and higher low is building, which is a sign that buyers taking control. My advice is to watch for buying opportunities. The key resistance and take profit level is set at the price of 1.2920 (previous swing low).