 English
  Русский
 Bahasa Indonesia
 Bahasa Malay
 ไทย
ไทย Español
 Deutsch
 Български
 Français
 Tiếng Việt
 中文
中文 বাংলা
বাংলা हिन्दी
 Čeština
 Українська
 Română

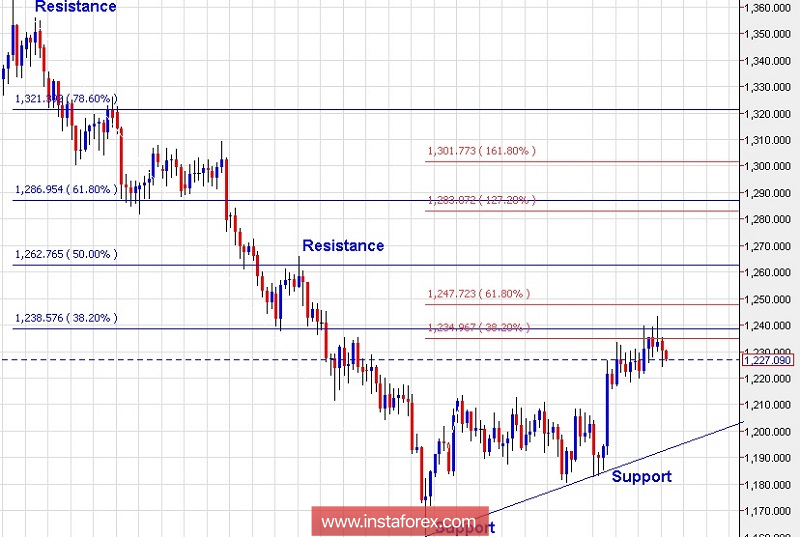
Technical outlook:
A daily chart view has been depicted for Gold to present a medium-term outlook for the metal. As seen here, the metal dropped from $1,360 levels through $1,160 earlier. The subsequent rally is corrective till now and is seen to have stalled at the fibonacci 0.382 resistance of the earlier drop. Please note that potential remains for a push higher towards $1,250 levels at least. Immediate price support on the daily chart is seen at $1,181.50 levels. Hence until prices remain above that, we can expect a rally towards higher levels. In case of a drop lower, the $1,210/15 zone would act as support now. Immediate price resistance is seen around $1,260 levels as shown here.
Trading plan:
Long Gold, stop $1,205, target $1,250/70
Good luck!