 English
  Русский
 Bahasa Indonesia
 Bahasa Malay
 ไทย
ไทย Español
 Deutsch
 Български
 Français
 Tiếng Việt
 中文
中文 বাংলা
বাংলা हिन्दी
 Čeština
 Українська
 Română

Gold price has reached the 61.8% Fibonacci retracement and the $1,222-23 resistance area as expected, after breaking above the $1,213 short-term resistance. Gold could continue a bit higher but I do not see it breaking above $1,243.50. I expect Gold price to soon reverse to the downside.
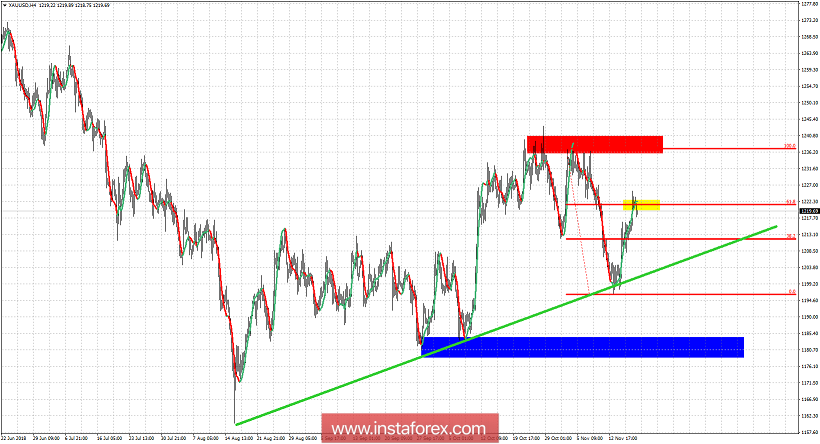
Blue rectangle - support area
Yellow rectangle - short-term resistance
Red rectangle - major resistance
Gold price has bounced from the green trend line support and has already reached the 61.8% Fibonacci level. This is important short-term resistance. If prices break below the green trend line we should expect Gold price to fall towards the blue area. If Gold price breaks above the $1,240-43.50 area we should expect Gold price to reach $1,255-60 area. I'm currently bearish expecting a lower high. I see this bounce as a selling opportunity with stops placed at $1,243.50.