 English
  Русский
 Bahasa Indonesia
 Bahasa Malay
 ไทย
ไทย Español
 Deutsch
 Български
 Français
 Tiếng Việt
 中文
中文 বাংলা
বাংলা हिन्दी
 Čeština
 Українська
 Română

Gold price made a higher high yesterday at $1,228.40 exactly at the 78.6% Fibonacci retracement and got rejected. Price has pulled back towards $1,220 and the RSI is showing bearish divergence signs.
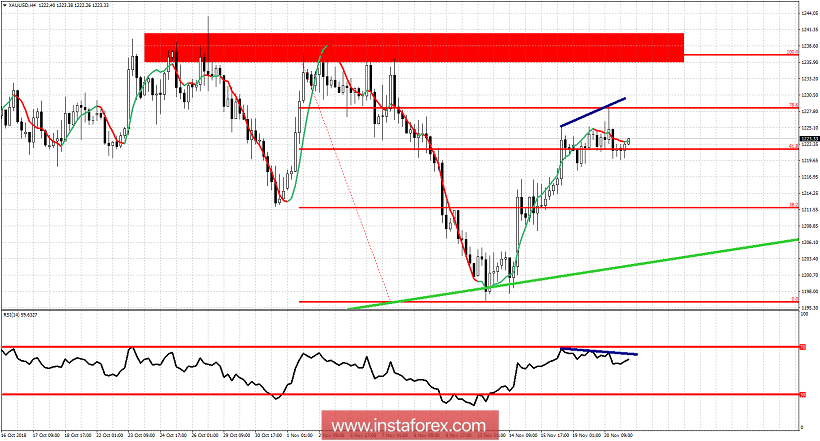
Red rectangle - major resistance area
Blue lines - bearish divergence
Green line - trend line support
Gold price is trading at important resistance area according to our Fibonacci levels. The RSI bearish divergence gives us a warning strengthening our expectations for a bearish reversal in Gold prices. Support is at $1,219. Major support is at the green trend line and rising at $1,204. Breaking below the green trend line will confirm our bearish view. Stop for bears is at the red resistance area. They do not want to see that level broken. In the short-term we could see another minor new higher high towards $1,230-33. If this higher high gives us a lower RSI high, bulls need to be very careful as it will increase the chances of a bearish reversal.